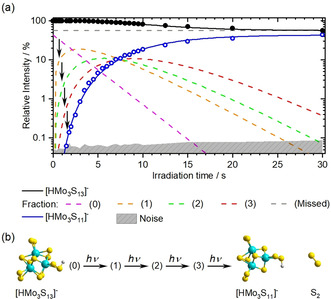
Figure 3.

(a) IRMPD kinetics for [HMo3S13]− → [HMo3S11]− + S2 dissociation. The experimental data is shown with black (precursor) and blue (fragment) circles and the kinetic fit with lines. Dashed lines represent precursor fractions. The sum of the fractions equals the measured precursor intensity. (b) Depiction of the implemented four‐photon kinetic model.
