Fig. 1.

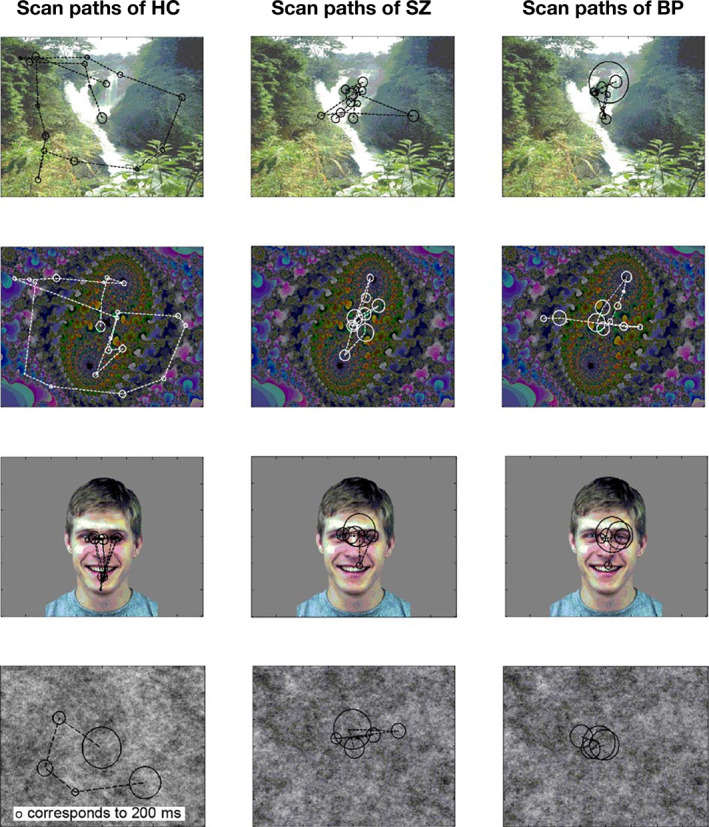
Representative visual scan paths to each stimulus type for one participant from each of the three groups (healthy control, schizophrenia and bipolar disorder). Reproduced from Bestelmayer et al., 248 with permission.

Representative visual scan paths to each stimulus type for one participant from each of the three groups (healthy control, schizophrenia and bipolar disorder). Reproduced from Bestelmayer et al., 248 with permission.