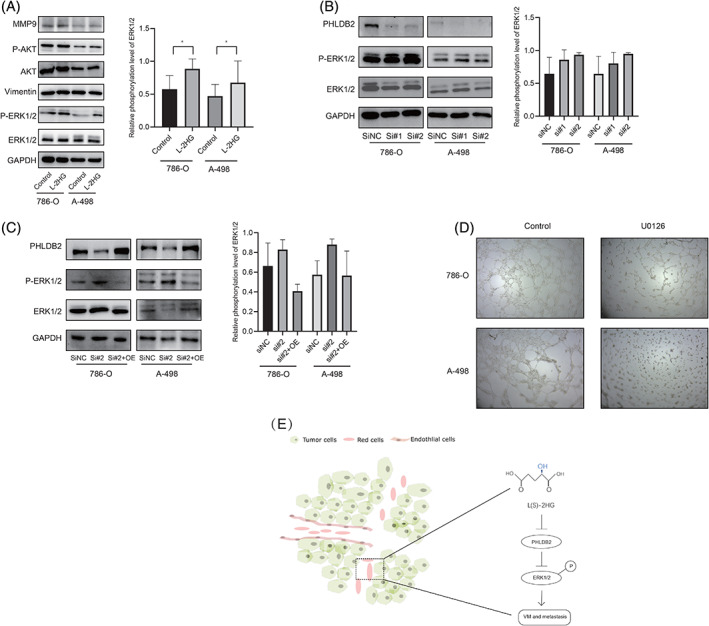
FIGURE 5.

L‐2HG induced VM formation via PHLDB2/ERK pathway. A, Western blot assay for the VM‐related genes expression after L‐2HG treatment in 786‐O and A‐498 cells. One corresponding loading control has been shown. Semiquantification of P‐ERK1/2 based on band density from three independent experiments was shown in the right panel. * P < .05. B, Western blot assay for comparing ERK1/2 phosphorylation in 786‐O and A‐498 cell lines after transfection siPHLDB2#1 or #2. One corresponding loading control has been shown. Semiquantification of P‐ERK1/2 based on band density from three independent experiments was shown in the right panel. C, Western blot assay for comparing siNC, siRNA#2 and siRNA#2 + OE PHLDB2. One corresponding loading control has been shown. Semiquantification of P‐ERK1/2 based on band density from three independent experiments was shown in the right panel. D, Images of VM formation after U0126 (1 μM) treatment for 24 hours in 786‐O and A‐498 cell lines. E, Schematic model illustrating the mechanism by which L‐2HG promotes VM and the aggressiveness of RCC [Color figure can be viewed at wileyonlinelibrary.com]
