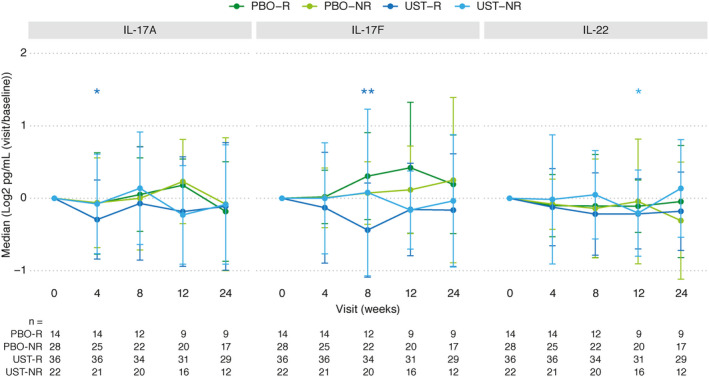
Figure 3.

Assessment of serum levels of IL‐17A, IL‐17F, and IL‐22 through week 24 in the placebo and ustekinumab treatment groups of SLE patients according to response status. Results are shown as the median change from baseline with median absolute deviation of the change. Numbers of subjects with available samples at each time point are indicated below the graphs. * = P < 0.05; ** = P < 0.01 versus baseline within group. Asterisk color indicates the treatment response group in which a significant difference was achieved. P values were computed using t‐tests. See Figure 1 for definitions.
