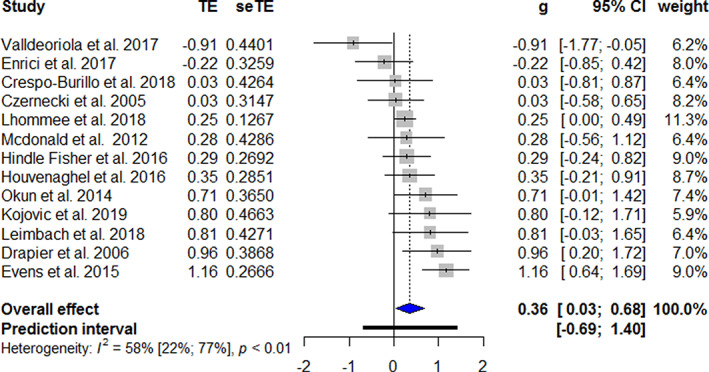
FIG. 3.

Forest plot of apathy after STN DBS in cross‐sectional studies. Treatment effects to the right favors more apathy. TE, treatment effect; seTE, standard error of the treatment effect; g, Hedges’ g; CI, confidence interval. [Color figure can be viewed at wileyonlinelibrary.com]
