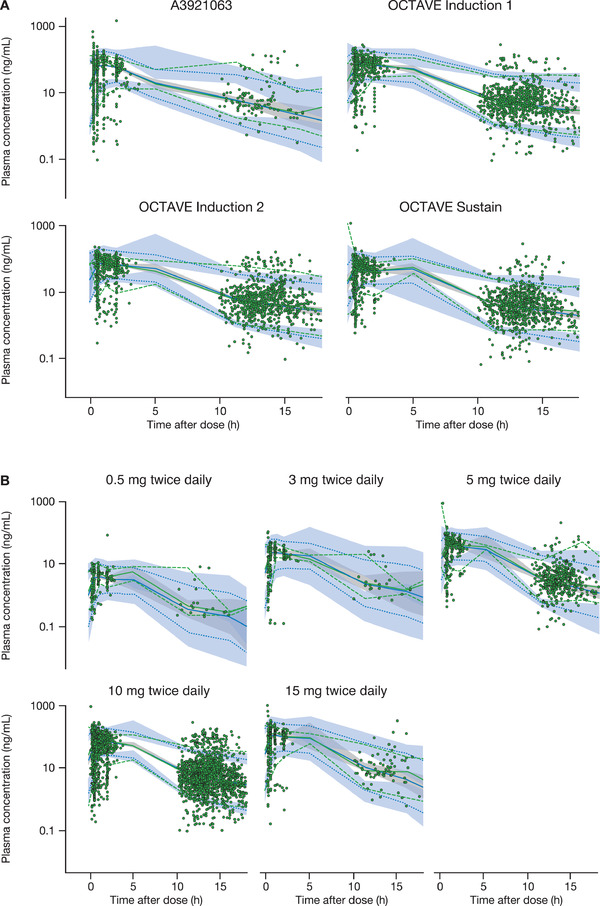
Figure 2.

Prediction‐corrected VPCs for the final model stratified by (A) study and (B) dose. The green dashed lines represent the 90%CI of observed data. The green solid line is the median of observed data. The blue dashed lines represent the 90% predictive interval based on simulations. The blue solid line represents the median based on simulations. The blue or gray shaded area is the predicted 95%CI of upper limit, lower limit, or median (50%), based on simulations. CI, confidence interval; h, hours; VPC, visual predictive check.
