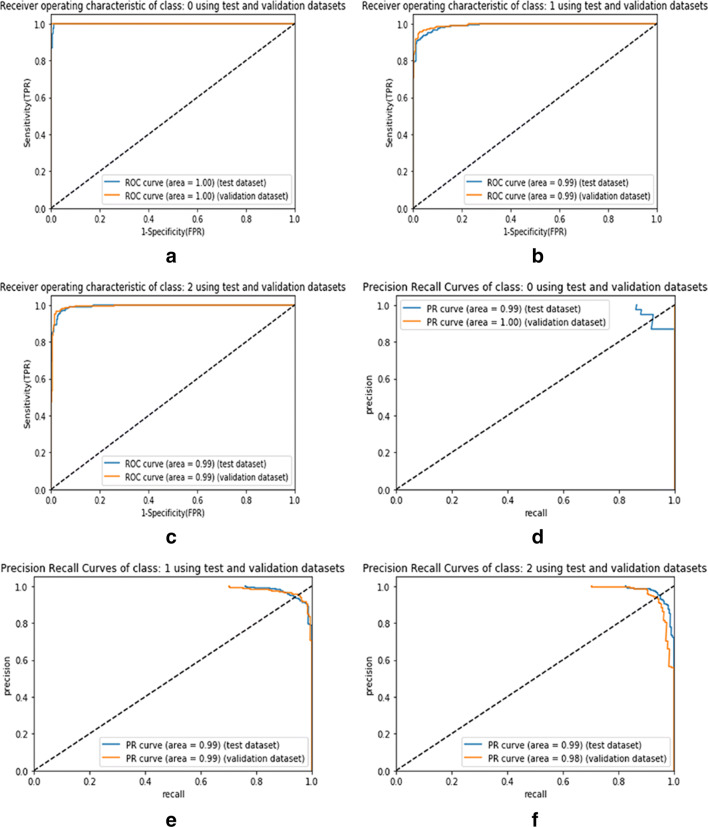
Fig. 7.
AU-ROC and AU-PR curves representing the ResNet50 model with balanced data for the individual classes such as COVID-19, viral pneumonia, and normal. Figure 7a to c visualize the AU-ROC curves, and Fig. 7d to f visualize the AU-PR curves. [Note: Labels 0, 1, and 2 represent the class names such as COVID-19, viral pneumonia, and normal samples, respectively]

