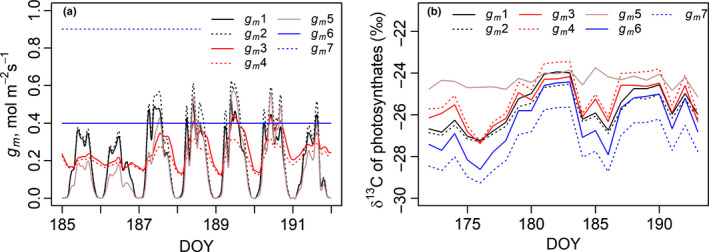
Fig. 4.

(a) Mesophyll conductance (mol m−2 s−1) of Pinus sylvestris during 7 d and (b) daily average isotopic composition of assimilated sugars during 22 d, modelled with gm descriptions 1–7 (Table 1). The driving factor of gm is A/Cc in descriptions 1 and 2, temperature in descriptions 3 and 4 and A/Cc and temperature in description 5. A further reduction related to water stress is added to descriptions 1 and 4. Descriptions 6 and 7 are constant g m. A shorter period is shown in (a) to more clearly visualise the within‐day patterns. DOY, day of year.
