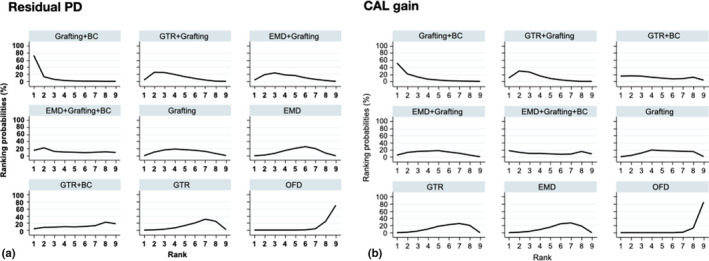
Figure 3.

Rankograms illustrating the relative ranking probability of the various interventions for residual PD and CAL gain. Interventions are arranged from the best intervention (upper left corner) to the worst (lower right corner)

Rankograms illustrating the relative ranking probability of the various interventions for residual PD and CAL gain. Interventions are arranged from the best intervention (upper left corner) to the worst (lower right corner)