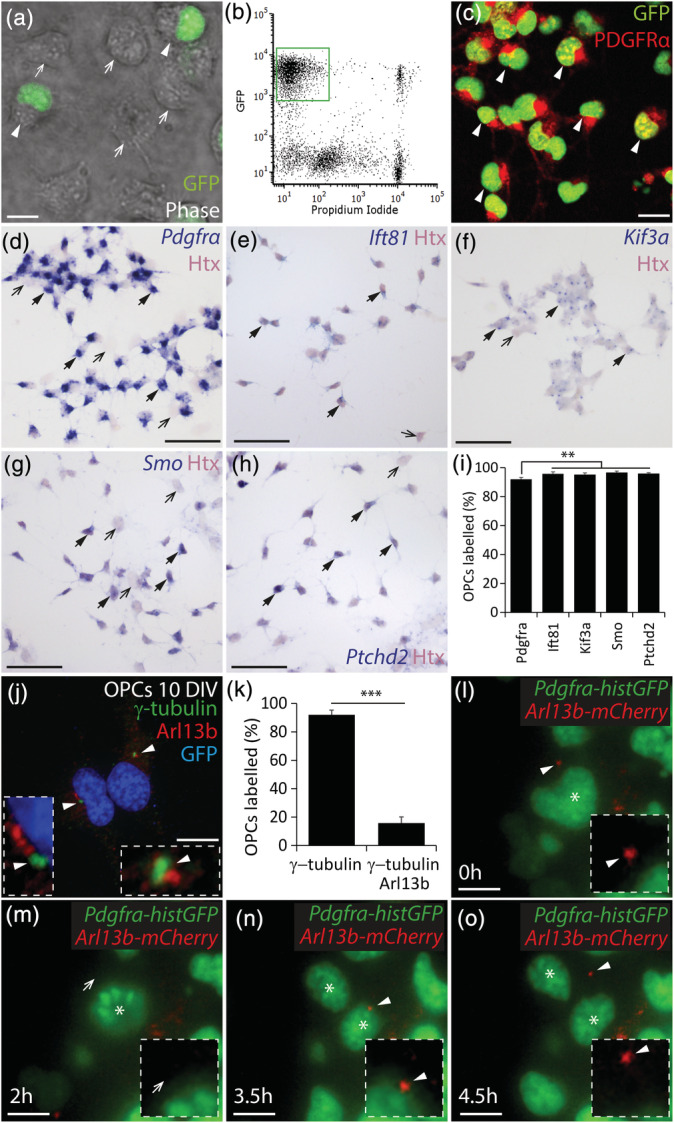
FIGURE 1.

OPCs assemble primary cilia in vitro. (a) Photomicrograph of 5 DIV mixed glial cultures (phase, greyscale), derived from Pdgfrα‐histGFP mice, showing the presence of GFP+ (green; white arrow heads) and GFP‐negative cells (white arrows). (b) Representative fluorescence activated cell sorting profile for 7 DIV mixed glial cultures derived from Pdgfrα‐histGFP mice. The green box denotes the GFP+ propidium iodide‐negative presumptive OPCs population to be isolated. (c) Representative image of 10 DIV GFP+ cells that were purified from 7DIV mixed glial cultures and immunostained to detect GFP (green) and PDGFRα (red). White arrow heads denote GFP+ PDGFRα+ OPCs. (d–h) 10 DIV OPC cultures that were stained with hematoxylin (Htx, pink) following in situ hybridization (blue) to detect Pdgfrα (d), Ift81 (e), Kif3a (f), Smo (g), and Ptched2 (h). Black arrows with solid arrow heads denote example Htx+ cells that co‐label for the target RNA. Black arrows denote example Htx+ cells that do not express the target RNA. (i) Graphical representation of the proportion of Htx+ cells that expressed each target RNA (%). N = 3–7 cultures were exposed to each probe and the data are expressed as mean ± SD. One‐way ANOVA F (4, 8) = 8.10, p = .006. Bonferroni post hoc analysis ** p < .003. (j) 10 DIV OPC culture immunostained to detect Arl13b (red), γ‐tubulin (green) and Hoescht 33,342 (HST, blue). White arrowheads denote primary cilia (Arl13b+ puncta adjacent to γ‐tubulin+ puncta). Insets show the primary cilia at a higher magnification. (k) Graphical representation of the proportion of GFP+ OPCs within each culture that have γ‐tubulin+ puncta and the proportion of GFP+ OPCs that elaborate γ‐tubulin+ Arl13b+ primary cilia (mean ± SD, n = 4–5 cultures). Unpaired t test (t = 28.7, df = 7), ***p < .0001. (l–o) Representative images from a time‐lapse movie of a dividing Pdgfrα‐histGFP OPC transfected with CMV‐Arl13b‐mCherry and imaged to visualize GFP+ nuclei (green) and mCherry+ primary cilia (red) before (l), during (m,n) and after cell division (o). A white arrowhead indicates a mCherry+ primary cilium. A white arrow head indicates the cell surface lacking the primary cilium. An asterisk denotes the mother and daughter cells. Insets show the cell surface at higher magnification, highlighting the presence or absence of a primary cilium on the mother cell. Scale bars represent 5 μm (a), 10 μm (c), 50 μm (d–h) and 12 μm (j, l–o) [Color figure can be viewed at wileyonlinelibrary.com]
