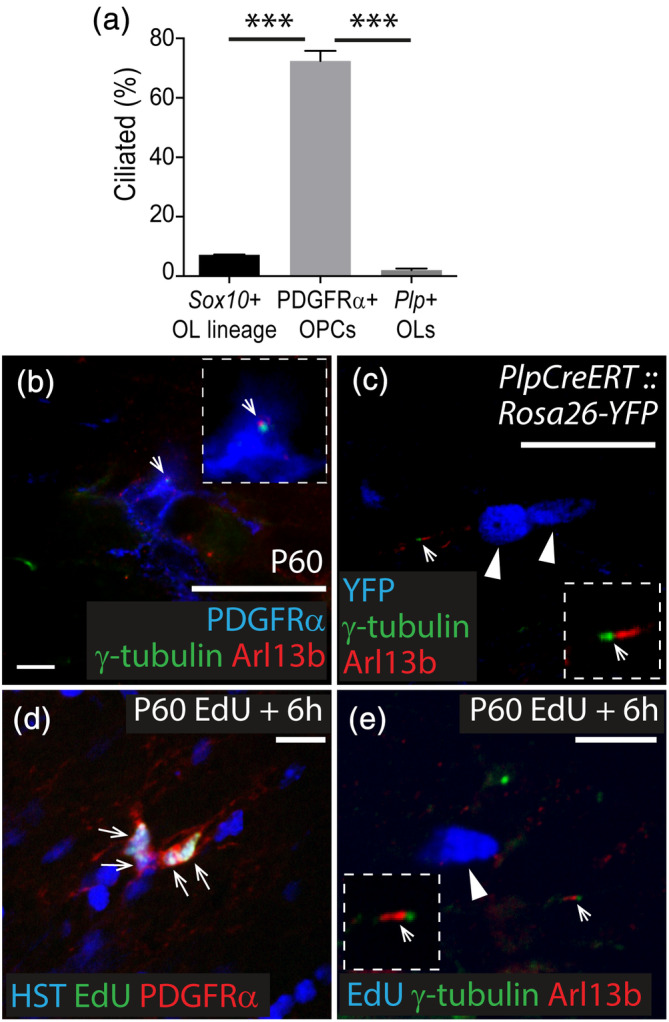
FIGURE 3.

Primary cilia are disassembled as OPCs enter the cell cycle and are not assembled by oligodendrocytes. (a) Quantification of the proportion of Sox10 + cells of the oligodendrocyte lineage, PDGFRα+ OPCs and Plp + oligodendrocytes that have assembled primary cilia. Data are expressed as mean ± SD for n = 3–4 mice per group. One‐way ANOVA F (2, 7) = 148.4, p < .0001. Bonferroni post hoc analysis ***p < .0001. (b) Representative confocal image from the CC of a P60 C57BL/6 mouse immunostained to detect PDGFRα (blue), Arl13b (red), and γ‐tubulin (green). White arrow indicates an Arl13b+ γ‐tubulin+ primary cilium on a PDGFRα+ OPC. Inset shows primary cilium at a higher magnification. (c) Representative confocal image from the CC of a P57+7 Plp‐CreERT:: Rosa26‐YFP mouse immunostained to detect YFP (blue), Arl13b (red) and γ‐tubulin (green). White arrow indicates Arl13b+ γ‐tubulin+ primary cilia assembled on a YFP‐negative cell (higher magnification inset). White arrow heads indicate YFP+ oligodendrocytes that do not express Arl13b or γ‐tubulin. (d) Representative confocal image from the CC proper of a P60 C57BL/6 mouse that received EdU for 6 hr and was immunostained to detect EdU (green), PDGFRα (red) and HST (blue). White arrows indicate EdU+ PDGFRα+ OPCs. (e) Representative confocal image from the CC proper of a P60 C57BL/6 mouse that received EdU for 6 hr and was immunostained to detect EdU (blue), Arl13b (red) and γ‐tubulin (green). White arrow indicates an assembled primary cilia on an EdU‐negative cell (inset at higher magnification). White arrow head indicates an EdU+ cell without primary cilia. Scale bars represent 30 μm (b, c) or 15 μm (d, e) [Color figure can be viewed at wileyonlinelibrary.com]
