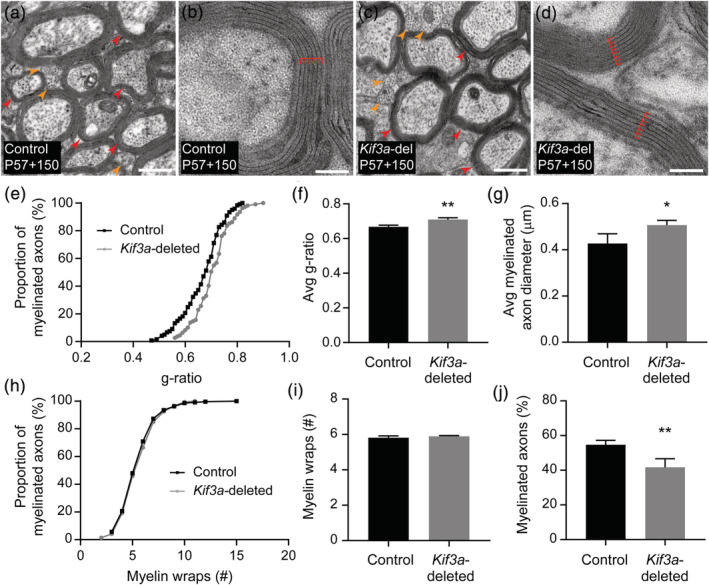
FIGURE 7.

Kif3a‐deletion is associated with an increase in g‐ratio attributed to increased axon diameter rather than a change in the number of myelin lamellae. (a–d) Transmission electron micrographs of transected axons in the CC of P57+150 Kif3a fl/fl (control; a, b) and Pdgfrα‐CreER™:: Kif3a fl/fl (Kif3a‐deleted; c, d) mice. The CC contains a mixture of myelinated and unmyelinated axons, and examples of these are indicated by the red and orange arrows, respectively. At high magnification, it is possible to identify the major dense lines of the myelin sheath (indicated by red lines) to count the number of myelin wraps (lamellae). Scale bars represent 0.5 μm (a, c) or 100 nm (b, d). (e) The g‐ratio was measured from transmission electron micrographs of the CC of n = 4 P57+150 control mice (n = 131 axons from n = 4 mice) and Kif3a‐deleted mice (n = 110 axons from n = 3 mice). This graph shows the cumulative proportion of axons across each g‐ratio for control and Kif3a‐deleted mice. K‐S test (K‐S D = 0.19), p = .02. (f) The average g‐ratio for myelinated axons in the CC of P57+150 Kif3a fl/fl (n = 4 control) and Pdgfrα‐CreER™:: Kif3a fl/fl (n = 3 Kif3a‐deleted) mice. Unpaired t test (t = 5.70, df = 5), p = .002. (g) The average diameter of myelinated axons in the CC of P57+150 Kif3a fl/fl (n = 4 control) and Pdgfrα‐CreER™:: Kif3a fl/fl (n = 3 Kif3a‐deleted) mice. Unpaired t test (t = 2.95, df = 5), p = .031. (h) The number of myelin wraps surrounding myelinated axons in the CC of P57+150 control mice (n = 213 axons from n = 4 mice) and Kif3a‐deleted mice (n = 146 axons across n = 3 mice). This graph shows the cumulative proportion of axons with a given number of myelin wraps. K‐S test (K‐S D = 0.04), p = .995. (i) The average number of myelin wraps surrounding myelinated axons in the CC of P57+150 Kif3a fl/fl (n = 4 control) and Pdgfrα‐CreER™:: Kif3a fl/fl (n = 3 Kif3a‐deleted) mice. Unpaired t test (t = 1.28, df = 5), p = .255. (j) The average proportion (%) of callosal axons that are myelinated in P57+150 control (n = 4) and Kif3a‐deleted (n = 3 ) mice. Unpaired t test (t = 4.61, df = 5), p = .005 [Color figure can be viewed at wileyonlinelibrary.com]
