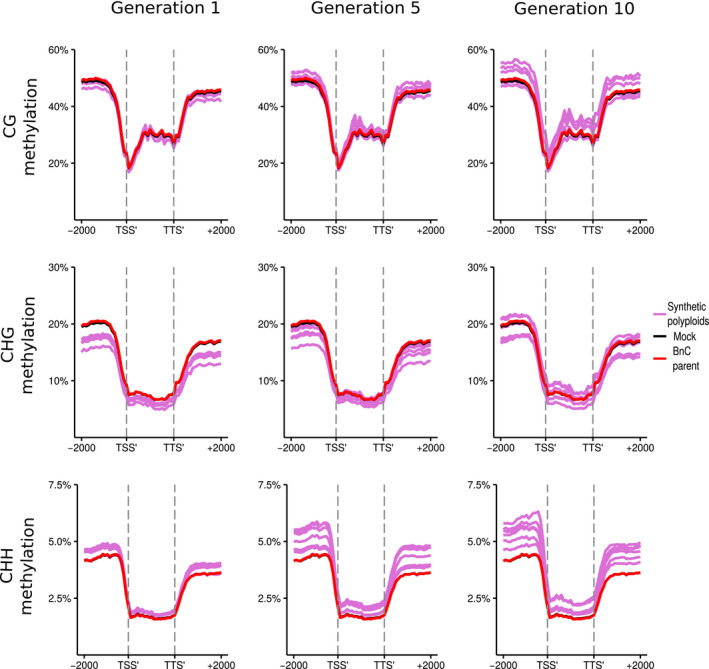
Fig. 5.

DNA methylation of BnC subgenome genes in resynthesised Brassica napus. Metaplots of CG, CHG and CHH mean weighted methylation of all gene models on the BnC subgenome for generations 1, 5 and 10 assessed using Bisulfite‐seq. The six resynthesised lines are shown in purple, the Brassica oleracea progenitor is shown in red and in silico mock polyploid in black as a visual control for cross‐mapping errors. Methylation levels are shown for the transcription start site (TSS′), gene body, transcription termination site (TTS′) and 2 kb upstream and downstream of the TSS and TTS.
