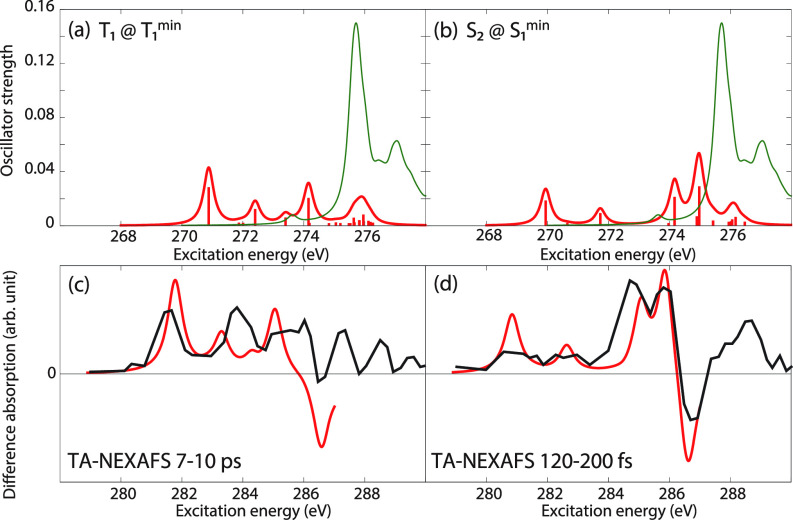
FIG. 10.
(a) and (b) Carbon K-edge NEXAFS for acetylacetone in the T1() and S2() states calculated at the MOM-TDDFT/B3LYP/6-311++G** level at the potential energy minima of T1() and S1(n), respectively. The green curve is the ground-state spectrum. In panels (c) and (d), the experimental transient absorption spectra at delay times of 7–10 ps and 120–200 fs are reported with black lines.22 In red are the computational transient absorption spectra reconstructed from the red and green curves of panels (a) and (b), respectively, shifted by +10.9 eV. The red curves of (a) and (b) were scaled by 0.75, and subtracted from the green curves, which were scaled by 0.25. FWHM of the Lorentzian convolution function is 0.4 eV for panels (a) and (b), 0.6 eV for panels (c) and (d), respectively.

