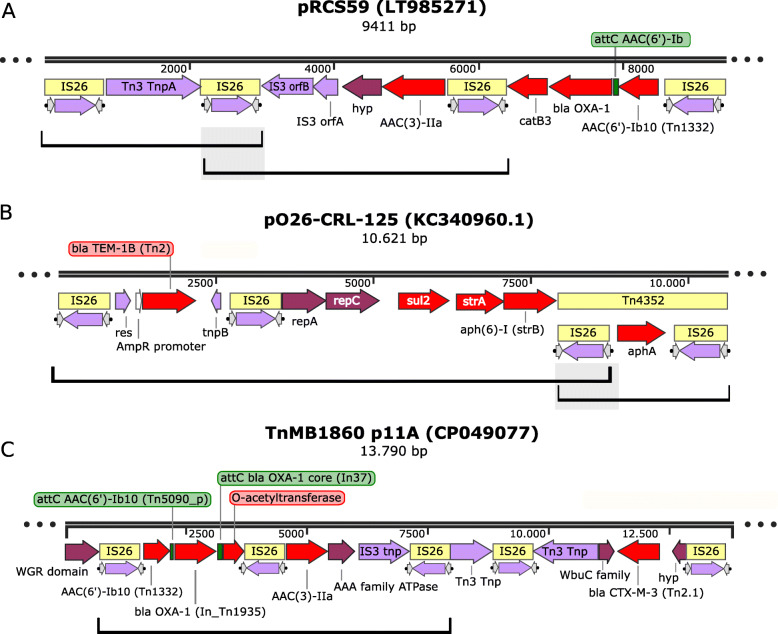
Fig. 4.
IS26 arrays. Genbank accession numbers for the DNA segments are shown in parentheses. Images were initially created using SnapGene. Open reading frames are shown as horizontal boxes where the arrowheads indicate the direction of translation. Red, antibiotic resistance genes; lavender, transposase related genes; purple, other; yellow boxes, IS copies; green boxes, integron cassette recombination sites; the terminal IRs are also shown. Grey boxes show the overlap between potential transposons. The figure shows a) overlapping potential transposons from plasmid pRCS59. b) plasmid pO26-CRL-125. c) the TnMB1860 DNA segment (Shropshire et al., 2020) PMID: 33164081). The major amplified segment is indicated by a horizontal bracket below. The horizontal brackets in a) and b) indicate overlapping potential transposons. The horizontal bracket in c)

