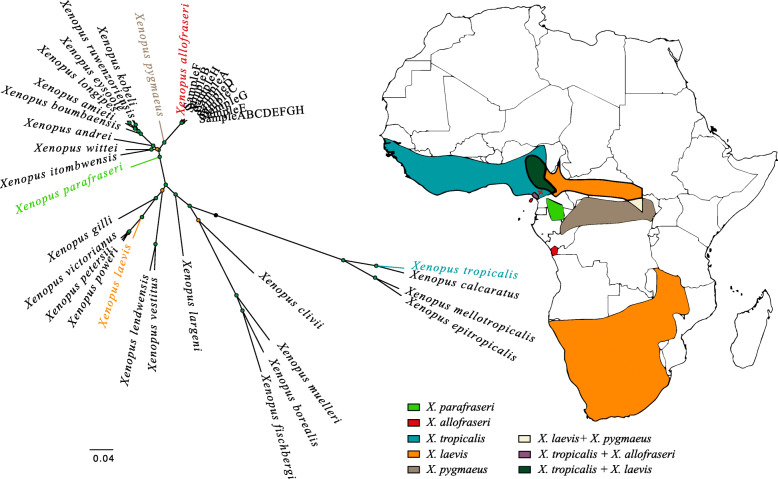
Fig. 2.
Geographic range of some Xenopus species in Africa and maximum-likelihood phylogenetic tree of the eight studied Xenopus males captured in Cameroon in 2009 (represented by a red cross). Geographic ranges were downloaded from the IUCN 2020 red list [29] and the map was created with QGIS v.3.14 (https://www.qgis.org/). The unrooted tree shows the phylogeny built with PhyML [30] based on mitogenomes assembled de novo (Sample A to H correspond to the reconstructed mitochondrial sequence based on each individual data whereas Sample ABCDEFGH corresponds to the reconstructed mitochondrial sequence from all individual data combined) and from mitogenomes of other Xenopus species previously published (corresponding GenBank accession numbers are presented in Table S2). The phylogenetic tree was designed using Figtree v.1.4.4 (http://tree.bio.ed.ac.uk/software/figtree/). The branch lengths are proportional to the number of substitutions per site with the scale indicated under the tree. The Shimoidara-Hasegawa (SH)-like branch support test is represented by node colors (p-value > 0.95 in green, p-value > 0.80 in orange, p-value < 0.80 in red)

