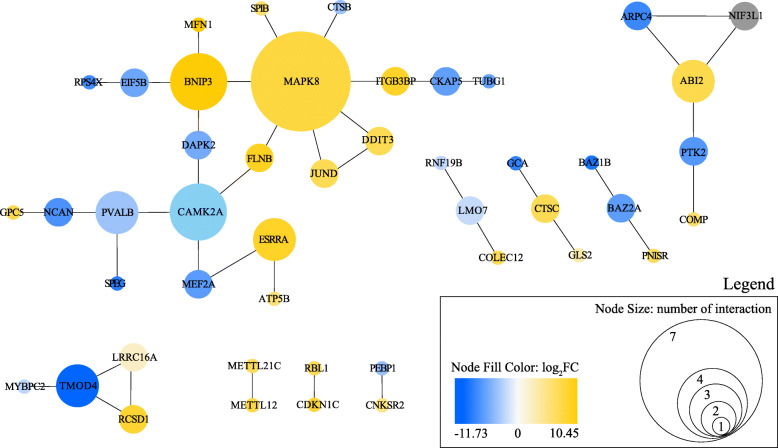
Fig. 4.
Gene interaction networks that contain 46/109 differentially expressed transcripts between endurant and burst-performant individuals. Differentially expressed transcripts were analyzed using STRING [31] using gene symbols of human orthologous genes for analysis (see the supplementary table to find corresponding X. allofraseri annotated transcripts), and visual inspection was finalized using Cytoscape [32]. The node color is based on the log2FC of expression data, with negative (blue) and positive (yellow) values representing up-regulated transcript expression in endurant and burst-performant individuals, respectively (grey color correspond to gene with transcript isoforms expressed in both groups). Node size represents the number of interactions with other protein-coding genes and allows to rapidly visualize central genes

