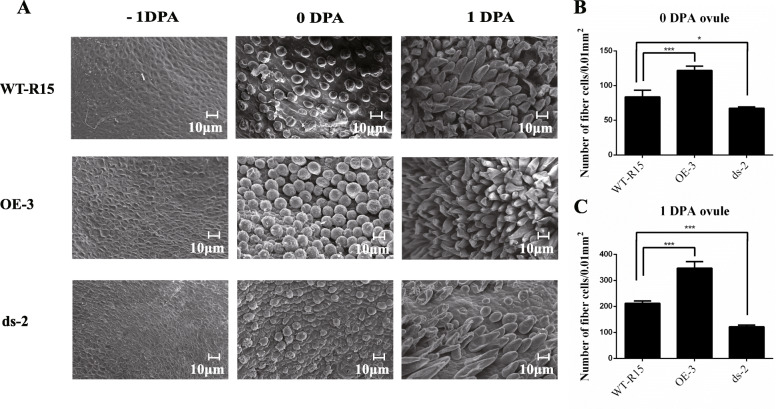
Fig. 9.
GhARF2b enhances the fiber initiation. a SEM images of WT-R15, OE-3 (over-expression line) and ds-2 (RNAi line) ovules at − 1, 0, 1 DPA. Bar = 100 μm [700 × magnification for ovules of − 1 and 0 DPA, 500 × magnification for 1-DPA ovules]. b Number of fiber cells per 0.01 mm2 of 0-DPA ovules in the overexpression (OE-3) and RNAi (ds-2) cotton lines compared to wild-type (WT-R15). Error bar indicates standard deviation; *** denotes significant difference from wild-type (Student’s t-test, P < 0.001, n = 30); * denotes significant difference from wild type (Student’s t-test, P < 0.05, n = 30). c Number of fiber cells per 0.01 mm2 of 1-DPA ovules in the overexpression (OE-3) and RNAi (ds-2) cotton lines compared to wild-type (WT-R15). Error bar indicates standard deviation; *** denotes significant difference from wild type (Student’s t-test, P < 0.001, n = 30)

