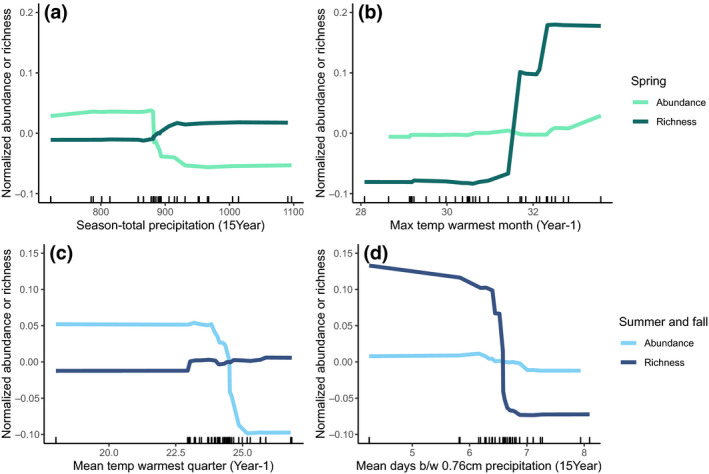
FIGURE 3.

Relationships between the most important landscape and climate variables and seasonal abundance and richness of wild‐bee communities. The abundance values shown are z‐score normalized (mean of zero and unit‐variance) to enable comparisons between different random‐forest models. We defined “spring” as prior to May 15th and “summer/fall” as after May 15th, based on the phenology of wild‐bees in our region (Figure 1)
