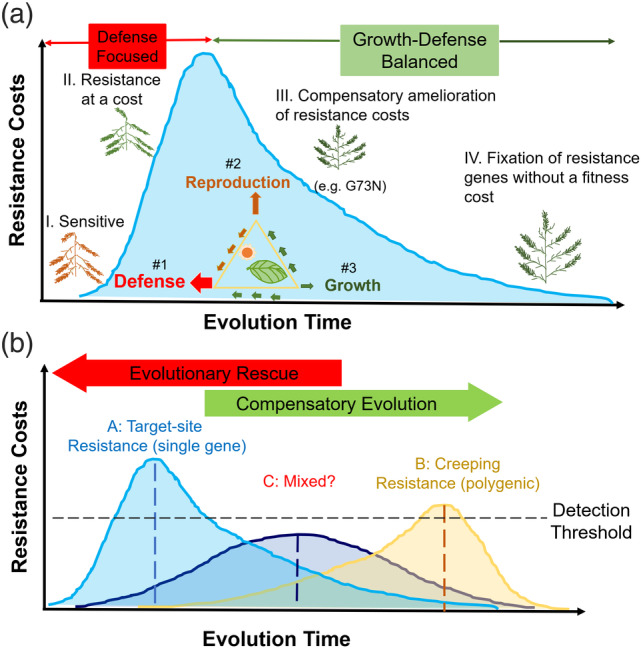
Figure 6.

Schematic illustration of evolutionary trajectories of fitness costs of herbicide resistance traits. (a) A hypothetical four‐phase model depicting the evolutionary trajectory of target‐site based synthetic auxins resistance. The energy plants fixed from photosynthesis can be allocated to defense, growth and reproduction with different prioritization levels. (b) Bell‐shaped curves of different colors represent the evolution trajectories of fitness costs of resistance with different genetic basis. (A) Target‐site resistance controlled by a single gene with major effects; (B) Creeping resistance controlled by multiple genes of small effects and (C) The mixture of the two types of resistance. Detection threshold indicates the sensitivity level of the fitness studies to detect the fitness costs.
