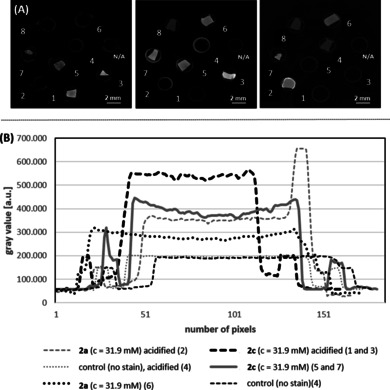
Figure 2.

(A) Representative μCT slices of the equimolar stained turkey liver pieces (incubation time 72 h) and (B) the corresponding line plots. 1: 2 c (c=31.9 mm), acidified; 2: 2 a (c=31.9 mm), acidified; 3: 2 c (c=31.9 mm), acidified; 4: control sample (no staining agent was applied), acidified; 5: 2 c (c=31.9 mm); 6: 2 a (c=31.9 mm); 7: 2 c (c=31.9 mm); 8: control sample (no staining agent was applied). Parameters of the μCT setup (V|tome|X, Phönix X‐ray/ GE) used for the measurement: U=50 kV; I=110 μA; exposure time: 2 s; pixel size: 40 μm. The μCT slices were chosen so that all investigated samples are visible as they are mounted in different positions within the sample holder. The gray values were normalized to the sample holder, which was the same for all stained samples (0.5 mL Eppendorf tube).
