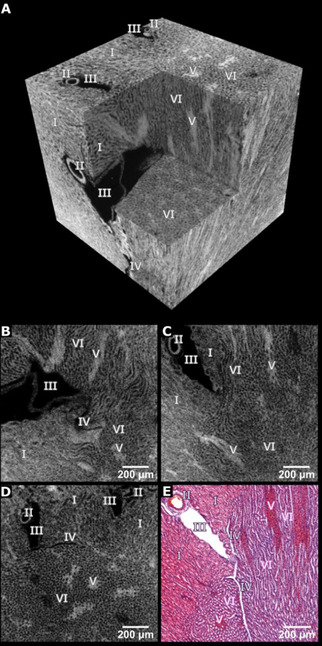
Figure 3.

High‐resolution μCT data of the cortex and outer medulla region of a mouse kidney after application of the dibromo fluorescein barium salt (9 c). (A) Representative μCT volume of 1.20 mm × 1.20 mm × 1.20 mm (effective voxel size ≈3.3 μm). (B–D) Individual μCT slices derived from the orthogonal planes through the volume shown in (A). (E) Representative X‐ray barium eosin Y‐stained histological microscopic slide. The cell nuclei were counter stained with Mayr's sour hematoxylin. Legend: I proximal convoluted tubules, II: artery, III: vein, IV: capillary, V: medullary rays, and VI: loop of Henle.
