
Figure 2.
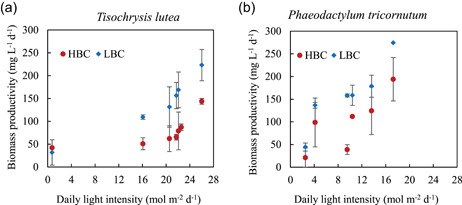
Biomass productivity (mg L−1 d−1) of Tisochrysis lutea (a) and Phaeodactylum tricornutum (b). Two cell concentrations were studied: low biomass concentration (LBC) of 0.4 g L−1 DW (diamond, blue), and high biomass concentration (HBC) of 1.1 g L−1 DW (circles, red) [Color figure can be viewed at wileyonlinelibrary.com]