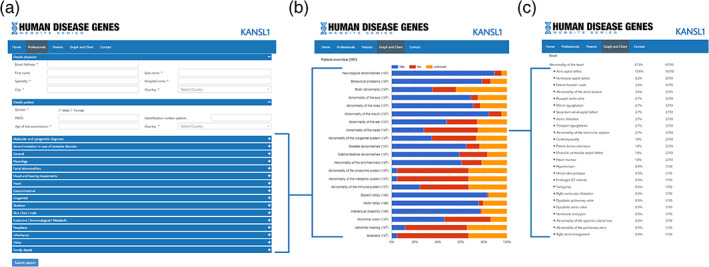
FIGURE 2.

The collection and summary of phenotypic data in the HDG website series, showing in three screenshots. (a) Online form clinicians can use to easily upload new clinical information per patient to a gene website. After curation, this information is then added to the database and a summary can be easily accessed in the phenotypic fingerprint in the graph and chart section (b). Here, all specific symptoms are listed with their absolute and relative count (c). Of note, the example print screens provided show data of Koolen‐de Vries syndrome [Color figure can be viewed at wileyonlinelibrary.com]
