
Fig. 1.
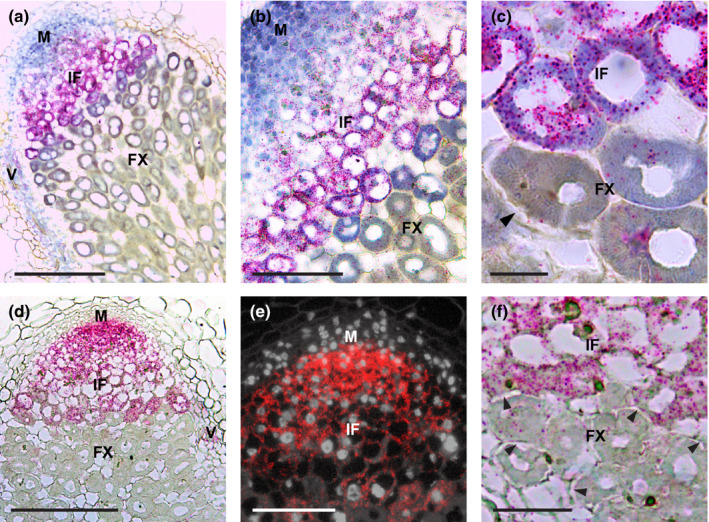
NIN and NF‐YA1 expression pattern in Medicago A17 nodule. An overview (a, d) and close‐up pictures (b, c, e, f) of RNA in situ localisation of NIN (a–c) or NF‐YA1 (d–f) in a nodule at 2 wk post inoculation (wpi). Hybridisation signals are visible as red dots. Arrowheads indicate amyloplast deposition. M, meristem; IF, infection zone; FX, fixation zone; V, vasculature. Bars: (a, d) 200 µm; (b, e) 100 µm; (c) 20 µm; (f) 50 µm.