
FIGURE 2.
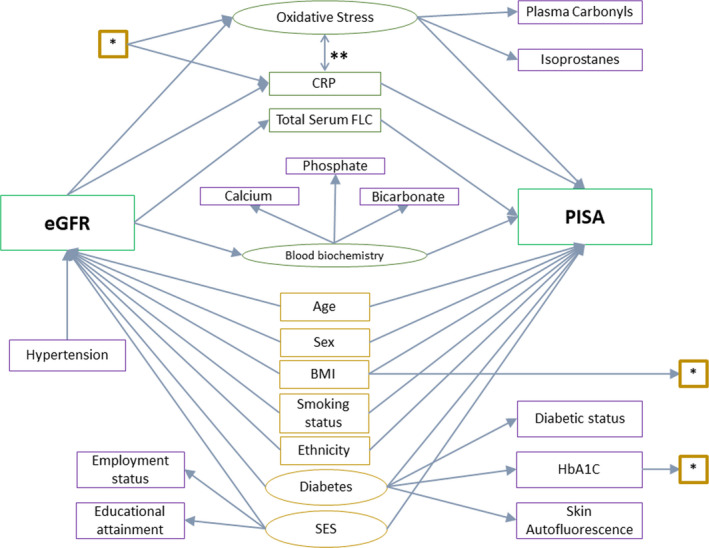
Causal diagram for the structural equation modelling with periodontal inflammation, PISA, as the outcome. Rectangles: observed variables; ovals: latent variable; green: exposure and outcomes of interest; purple: confounders; orange: mediators. *—paths included in Model 2, in addition to the base model. **—paths included in Model 3, in addition to Model 2. BMI, body mass index; CRP, c‐reactive protein; eGFR, estimated glomerular filtration rate; FLC, free light chain; HbA1C, glycated haemoglobin A1C; PISA, periodontal inflamed surface area; SES, socio‐economic status