FIGURE 2.

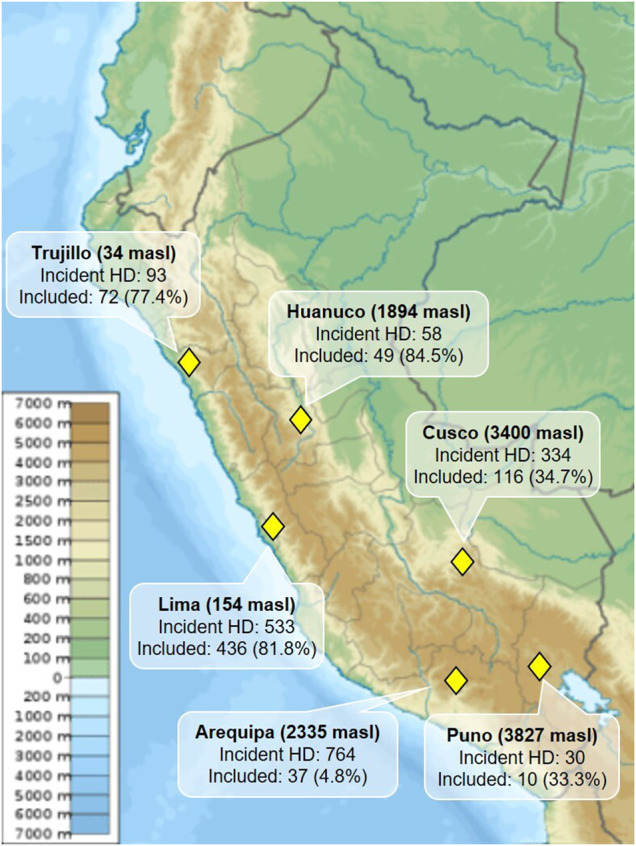
Map of Peru displaying the location and name of the participating cities according to altitude level as well as the number of incident HD patients and number of patients included in our study. Map source: Wikimedia Commons.

Map of Peru displaying the location and name of the participating cities according to altitude level as well as the number of incident HD patients and number of patients included in our study. Map source: Wikimedia Commons.