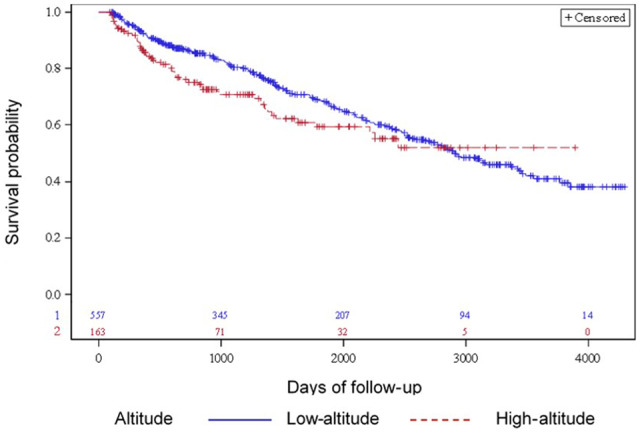
FIGURE 3.

Survival plot displays the estimated survival time for patients at low and high altitude, with the number of subjects at risk at 0, 1000, 2000, 3000 and 4000 days. Patients at high altitude have a nonsignificant trend toward lower survival in unadjusted analysis.
