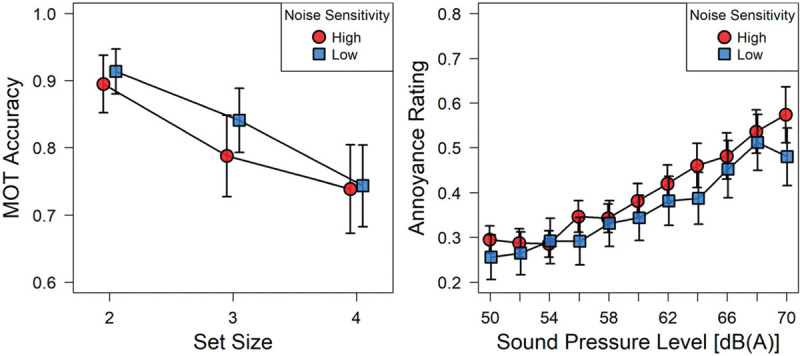
Figure 2.

Left: Mean accuracy in the visual attention task as a function of set size (the number of objects to be tracked). Right: Mean annoyance ratings as a function of SPL. Both graphs show separate curves for the group of highly noise sensitive participants (Nhigh = 14) contrasted with those of low noise sensitivity (Nlow = 15). Error bars denote standard errors of the means.
