Figure 4.

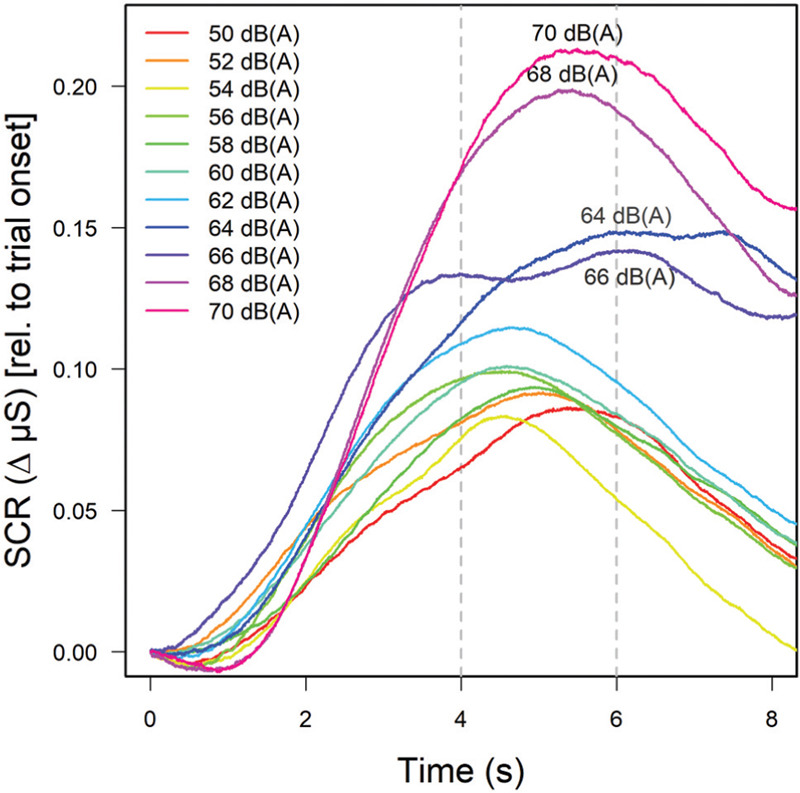
Mean skin conductance responses as a function of sound level (see figure legend). Curves are based on 18 trials per level and participant and averaged across 28 subjects for whom valid electrodermal data were obtained.

Mean skin conductance responses as a function of sound level (see figure legend). Curves are based on 18 trials per level and participant and averaged across 28 subjects for whom valid electrodermal data were obtained.