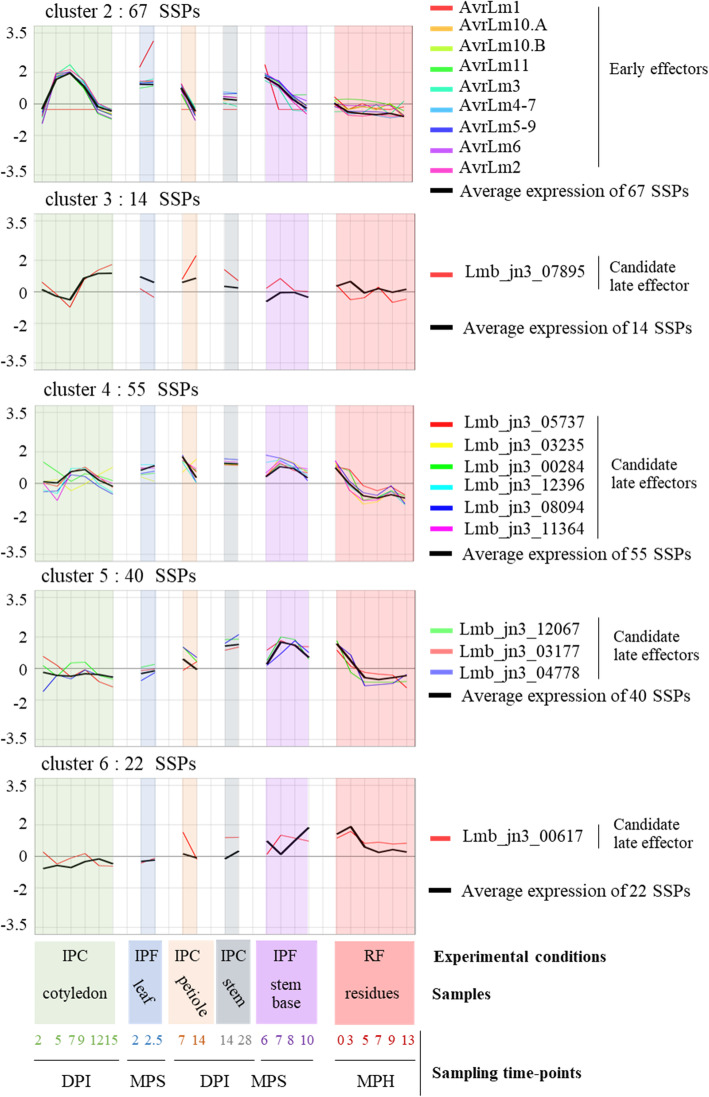
Fig. 5.
Expression of known and putative effectors of Leptosphaeria maculans within the eight expression clusters. The scaled Log2(FPKM + 1) expression values for the nine avirulence effector (AvrLm) genes, and the eleven candidate late effector genes shown to be upregulated in at least one set of conditions in planta are represented and grouped according to cluster assignment. The mean scaled Log2(FPKM + 1) values of all the small secreted protein (SSP) genes in each cluster are indicated (black bold curve). The total number of SSP genes in each cluster is indicated. The conditions are described in the legend to the x-axis. Three sample features are described: (i) the experimental conditions: IPF, in planta field conditions; IPC, in planta controlled conditions; RF, residues in field conditions; (ii) the type of plant tissue sampled; and (iii) the sampling time points (DPI, days post inoculation; MPS, months post sowing; MPH, months post harvest)

