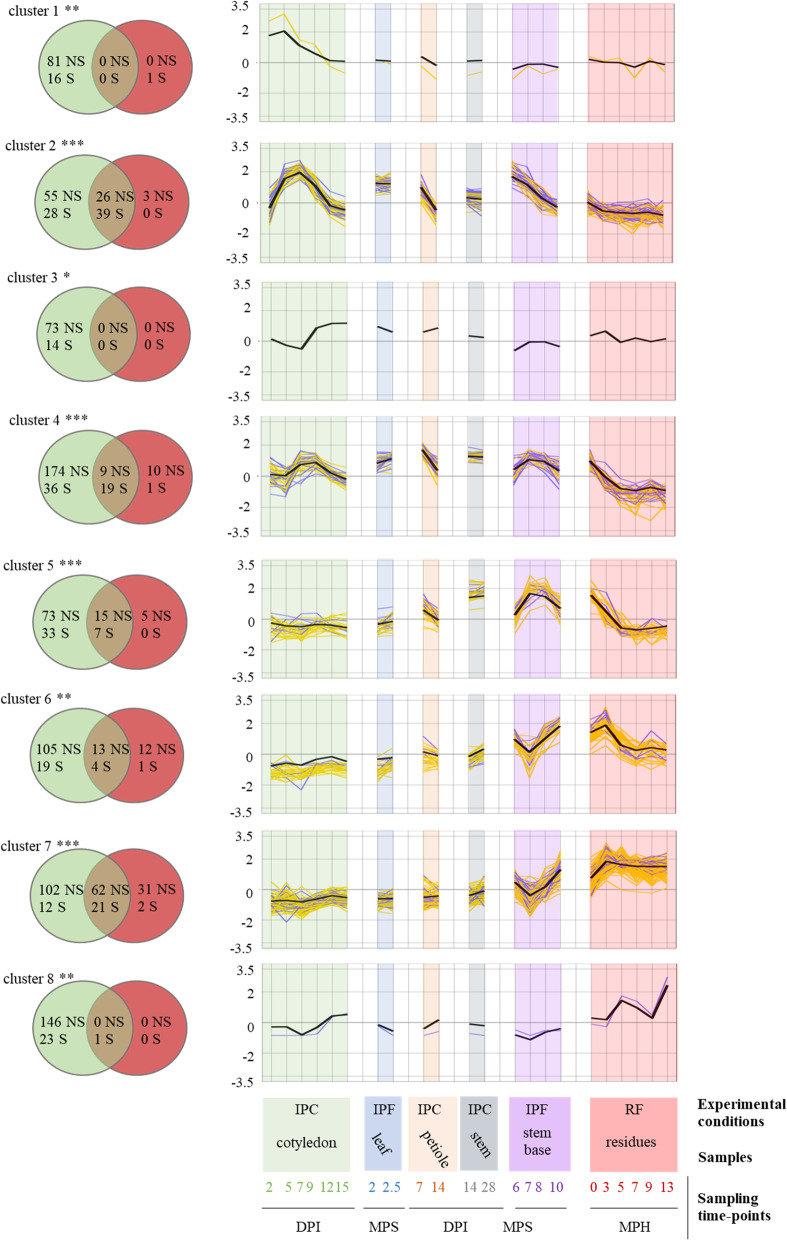
Fig. 7.
Identification of highly coregulated Leptosphaeria maculans genes based on mean SSP gene expression in planta. The mean scaled Log2(FPKM + 1) values for small secreted protein (SSP) genes in each cluster (clusters 1 to 8) were used to create the eight reference expression profiles (black bold curve). The 22 sets of biological conditions used to average SSP gene expression are described in the legend to the x-axis. Three sample features are described: (i) the experimental conditions: IPF, in planta field conditions; IPC, in planta controlled conditions; RF, residues in field conditions; (ii) the type of plant tissue sampled; and (iii) the sampling time points (DPI, days post inoculation; MPS, months post sowing; MPH, months post harvest. A linear regression analysis was performed to determine the correlation between the scaled Log2(FPKM+ 1) value for the whole set of genes in the 22 sets of conditions and these eight reference expression profiles. A gene was considered to be highly correlated if its expression fitted the reference expression profile (in black) with an R-squared value > 0.80 and a corrected p value < 0.05. The expression values of the resulting highly correlated gene subsets (SSP in blue and non-SSP in yellow) are plotted. The Venn diagrams show the number of genes (S: SSP, NS: Non-SSP) present in each cluster (green circles) and the number of genes identified as highly correlated with the corresponding expression profile (red circles). The asterisks indicate the significance of the SSP enrichment in the initial cluster (***: p < 0.001, **: p < 0.01)

