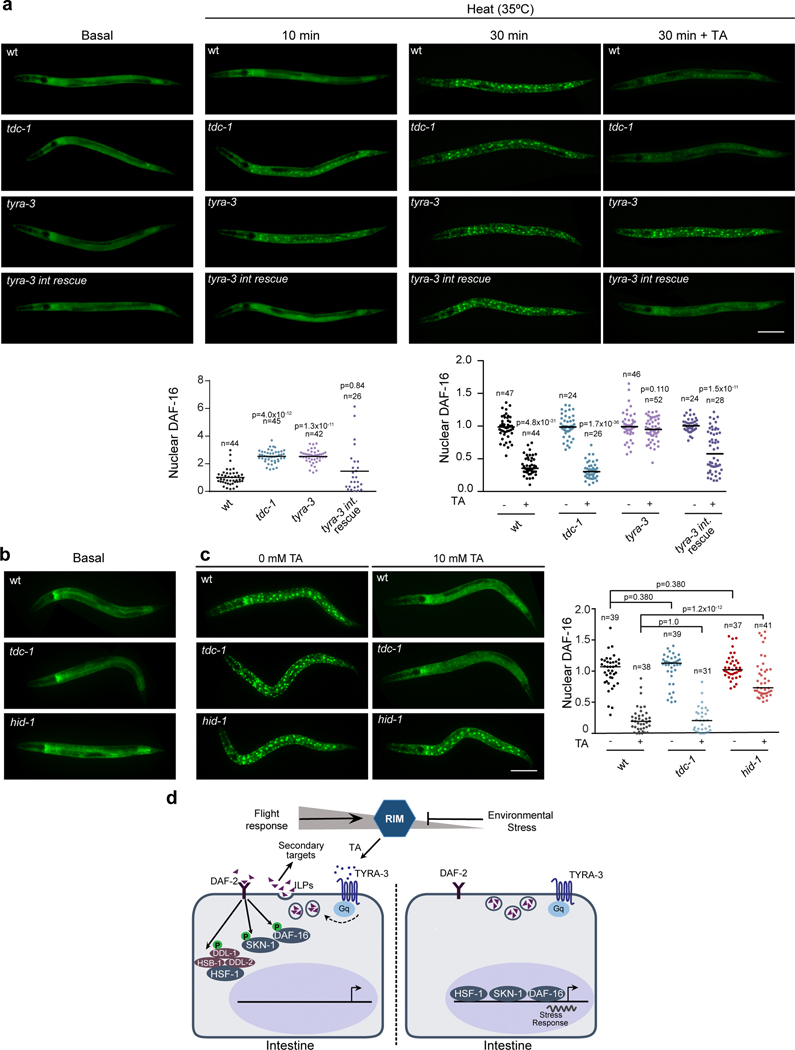
Figure 4. Tyramine signaling inhibits stress-dependent nuclear translocation of DAF-16.
a, DAF-16a/b::GFP localization in basal condition and upon exposure to heat (35°C) for 10 min and 30 min in the absence or presence of tyramine (10 mM TA, 30 min). Scale bar: 150 μm. Bottom, Corresponding scatter dot plot with the number of cells with nuclear DAF-16 per animal (normalized to naïve animals, line at the mean). For 10 min heat conditions, One-way ANOVA Holm-Sidak’s post-hoc test versus wild-type was used. For 35 min heat conditions, a two-tailed t-test (no TA vs TA) was used. The experiment was repeated 4 times (n=4). For each condition n is indicated in the figure. b-c, DAF-16a/b::GFP localization in hid-1 mutants in basal conditions (b) and upon exposure to heat (35°C, 30 min) in the absence or presence of tyramine (c). Right, scatter dot plot with nuclear DAF-16 expression normalized to naïve animals (line at the mean). One-way ANOVA (Kruskal-Wallis test) and Dunn’s post-hoc test were used. The experiment was repeated 3 times (n=3). For each condition, n is indicated in the figure. d, Model: Tyraminergic modulation of the DAF-2/IIs pathway.

