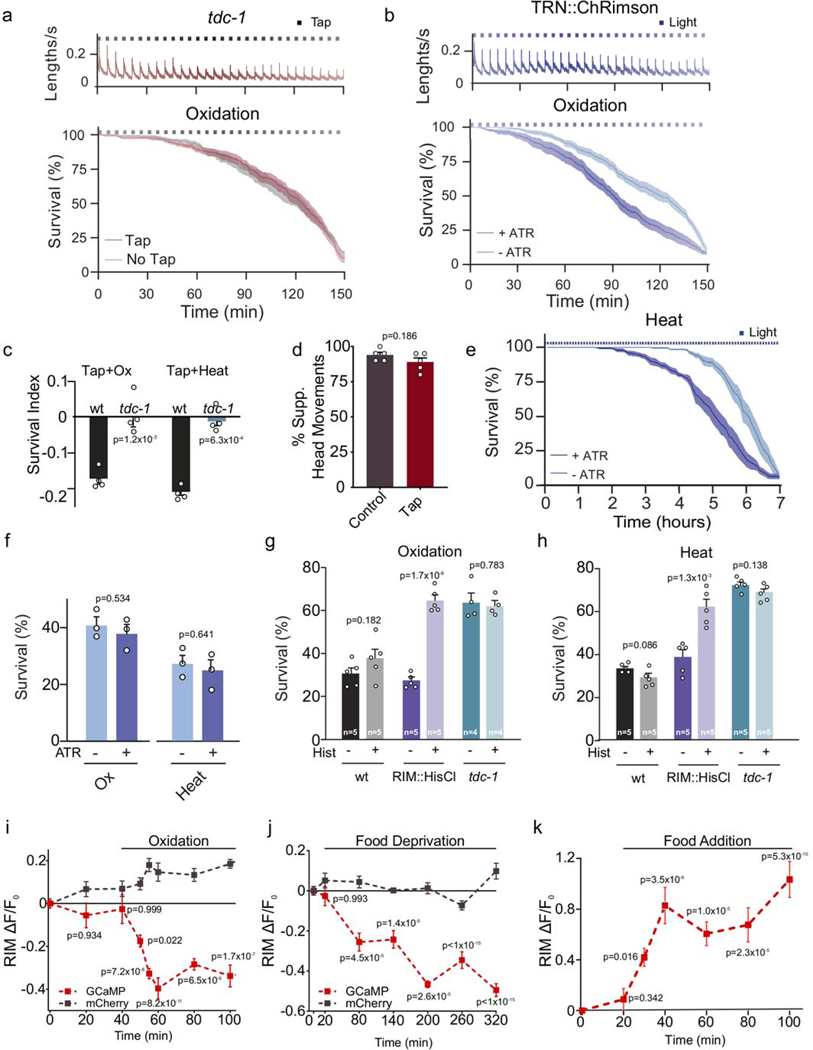
Extended Data Figure 4. Optogenetic activation of the flight response reduces the resistance to environmental stressors.
a, Velocity traces and survival curves during strong oxidative stress (3 mM Fe2+) for tdc-1 mutants in the absence (grey) or presence (red) of a mechanical stimulus (tap), n=7 independent experiments of 40 animals were used for each condition. Velocity remains constant over the 2.5 h duration of recording in the absence of a stimulus, but increases rapidly in response to a mechanical plate tap (top). Tap delivery does not reduce stress resistance in tdc-1 mutants (bottom) to oxidative stress. Black squares indicate timing of tap delivery. Red line: tap, grey line: no tap, shaded regions indicate SEM. b, Optogenetic activation of the mechanosensory neurons induces a flight response that results in velocity increases. Animals are exposed to 5 second pulses of 617nm light every 5 minutes (top), n=8 independent experiments. Optogenetic induction of the flight response reduces stress resistance to strong oxidation (3 mM Fe2+) (bottom). Dark blue line: survival curve of animals raised with all-trans retinal (ATR) n=10 independent experiments; Light blue line: animals raised without ATR, n=9 independent experiments, 40 animals were used for each experiment. Central lines indicate mean, shaded regions indicate SEM, blue squares indicate timing of light delivery. Strain used: QW1649 zfIs144[Pmec-4::Chrimson::wCherry, pL15EK]. c, Survival index of animals, with or without vibrational stimulus (plate tapping every 5 minutes) while being exposed to oxidative (1 h, 3 mM Fe2+) or heat stress (4 h at 35°C). Tap impaired environmental stress resistance in the wild type, but not in tdc-1 mutant animals. Bars represent the mean ± SEM from 4 independent experiments (n=4). 60–90 animals per condition per experiment. Two-tailed Student’s test was used for statistical comparison versus the wild type. d, Percentage of animals suppressing head movements in response to anterior touch in unstressed animals and animals that have been subjected to a tap stimulus every 5 minutes for 2.5 hours. Tyramine release in response to mechanical stimulation induces a fast reversal and the suppression of head movements13–14 Animals that were subjected to 30 taps administered every 5 minutes still suppress their head movements in response to anterior touch. This indicates that tyramine continues to be released during the tapping protocol and that RIM neuronal activity is not affected. Bars represent the mean ± SEM from 5 independent experiments (n =5). 20 animals per condition per experiment were used. Two tailed Student’s t-test. e, Survival curves of animals exposed to heat stress (7 h at 35°C) with simultaneous optogenetic activation of mechanosensory neurons (QW1649: zfis144[Pmec-4::Chrimson::wCherry +pL15EK]). Animals expressing Chrimson in mechanosensory neurons were cultivated in the presence or absence of all-trans retinal (ATR) and subjected to 5 second 617 nm light pulses every 5 minutes at 35°C. Blue squares indicate timing of light delivery. Central lines indicate mean, shaded regions indicate SEM. Optogenetic activation of mechanosensory neurons reduced heat resistance in animals raised on ATR (n=6 independent experiments) compared to animals raised without ATR (n=5 independent experiments), 40 animals were used for each experiment. f, Stress survival analysis of animals grown in the presence or absence of ATR without light stimulation. Oxidative stress: (Ox,1 h, 3 mM Fe2+); Heat (4 h at 35°C). ATR does not modify animal resistance to these environmental stressors. Bars represent the mean ± SEM from 3 independent experiments (n=3). 40–50 animals per condition per experiment. No significant differences were observed indicating that ATR does not affect stress resistance, two-tailed Student’s t-test. g-h, Stress survival of animals expressing the histamine-gated chloride channel HisCl in the RIM neuron (RIM::HisCl). Animals were exposed to 10 mM histamine (Hist) prior and during oxidation (1 h, 15 mM Fe2+, g) or heat (4 h, 35°C h). Specific silencing of the RIM neuron leads to increased animal resistance to environmental stress. Bars represent mean ± SEM. The numbers of independent experiments performed for each condition (n) are indicated in the figure. 80–100 animals per condition per experiment were used. Statistical comparison versus same strain in the absence of histamine was calculated using two-tailed Student’s t-test. i-j, Ca2+ responses upon oxidative-stress (i, GCaMP: n=36 animals, mCherry: n=15 animals) and food deprivation (j, GCaMP: n=30 animals, mCherry: n=6 animals). Grey trace: mCherry fluorescence insensitive to calcium. Central lines and dots indicate mean, shaded regions and error bars indicate SEM (One-way ANOVA, compared to initial time point, Dunnett’s multiple comparison). k, Overall RIM Ca2+ levels (ΔF/F) increase upon refeeding (with E. coli) of animals that have been starved overnight. Data are represented as mean ± SEM. n=36 for each data point, 6 independent experiments. Fluorescence increase is initiated within 10 minutes after food addition indicating that RIM activity quickly recovers and is likely not due to GCaMP expression changes. One-way ANOVA, compared to initial time point, Dunnett’s multiple comparison.

