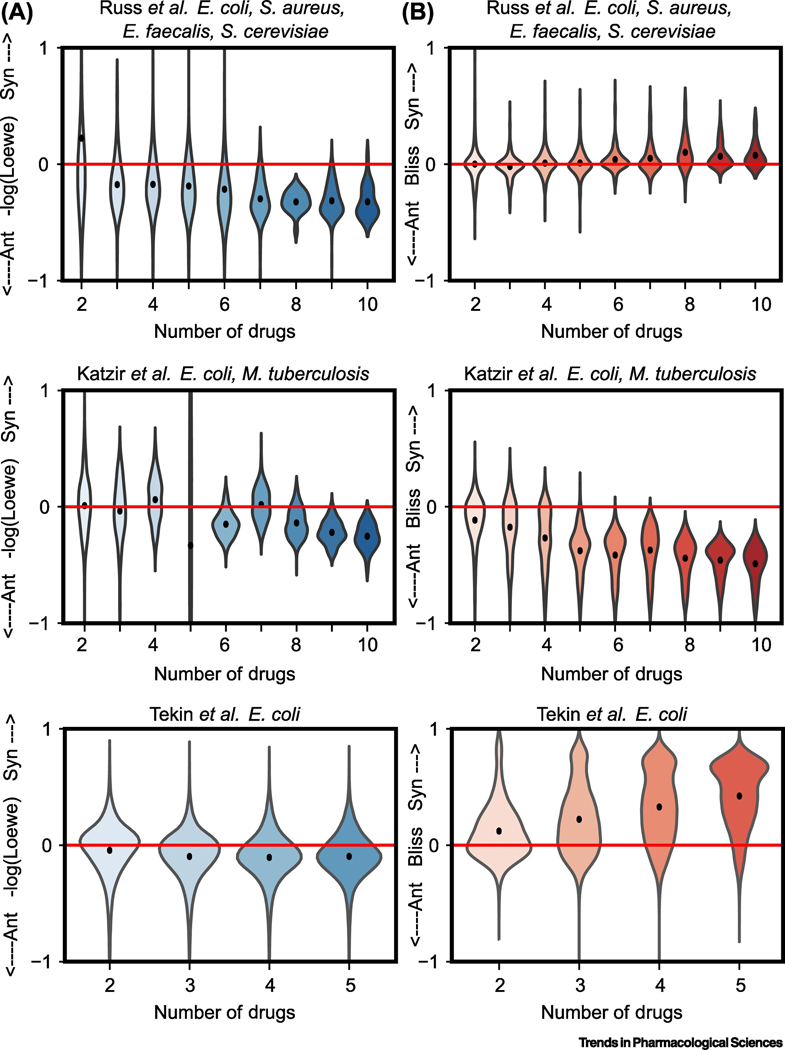
Figure 5: Seeking consensus on the existence and nature of higher-order interactions.
A) Average Loewe synergy decreases for an increasing number of drugs in three datasets (Russ et al. [56], Katzir et al. [59], and Tekin et al. [34]). The black dot is the mean value of the distribution. Red-line demarcates synergy (Syn) from antagonism (Ant). The species tested in each paper are indicated in the panel title. B) Distribution of Bliss synergy as a function of increasing numbers of drugs. Accounting for the difference between percent effect and percent affect reduced the bias toward antagonism for ultra-high order combinations in the Katzir et al. data (Figure S6A).

