Figure 2.

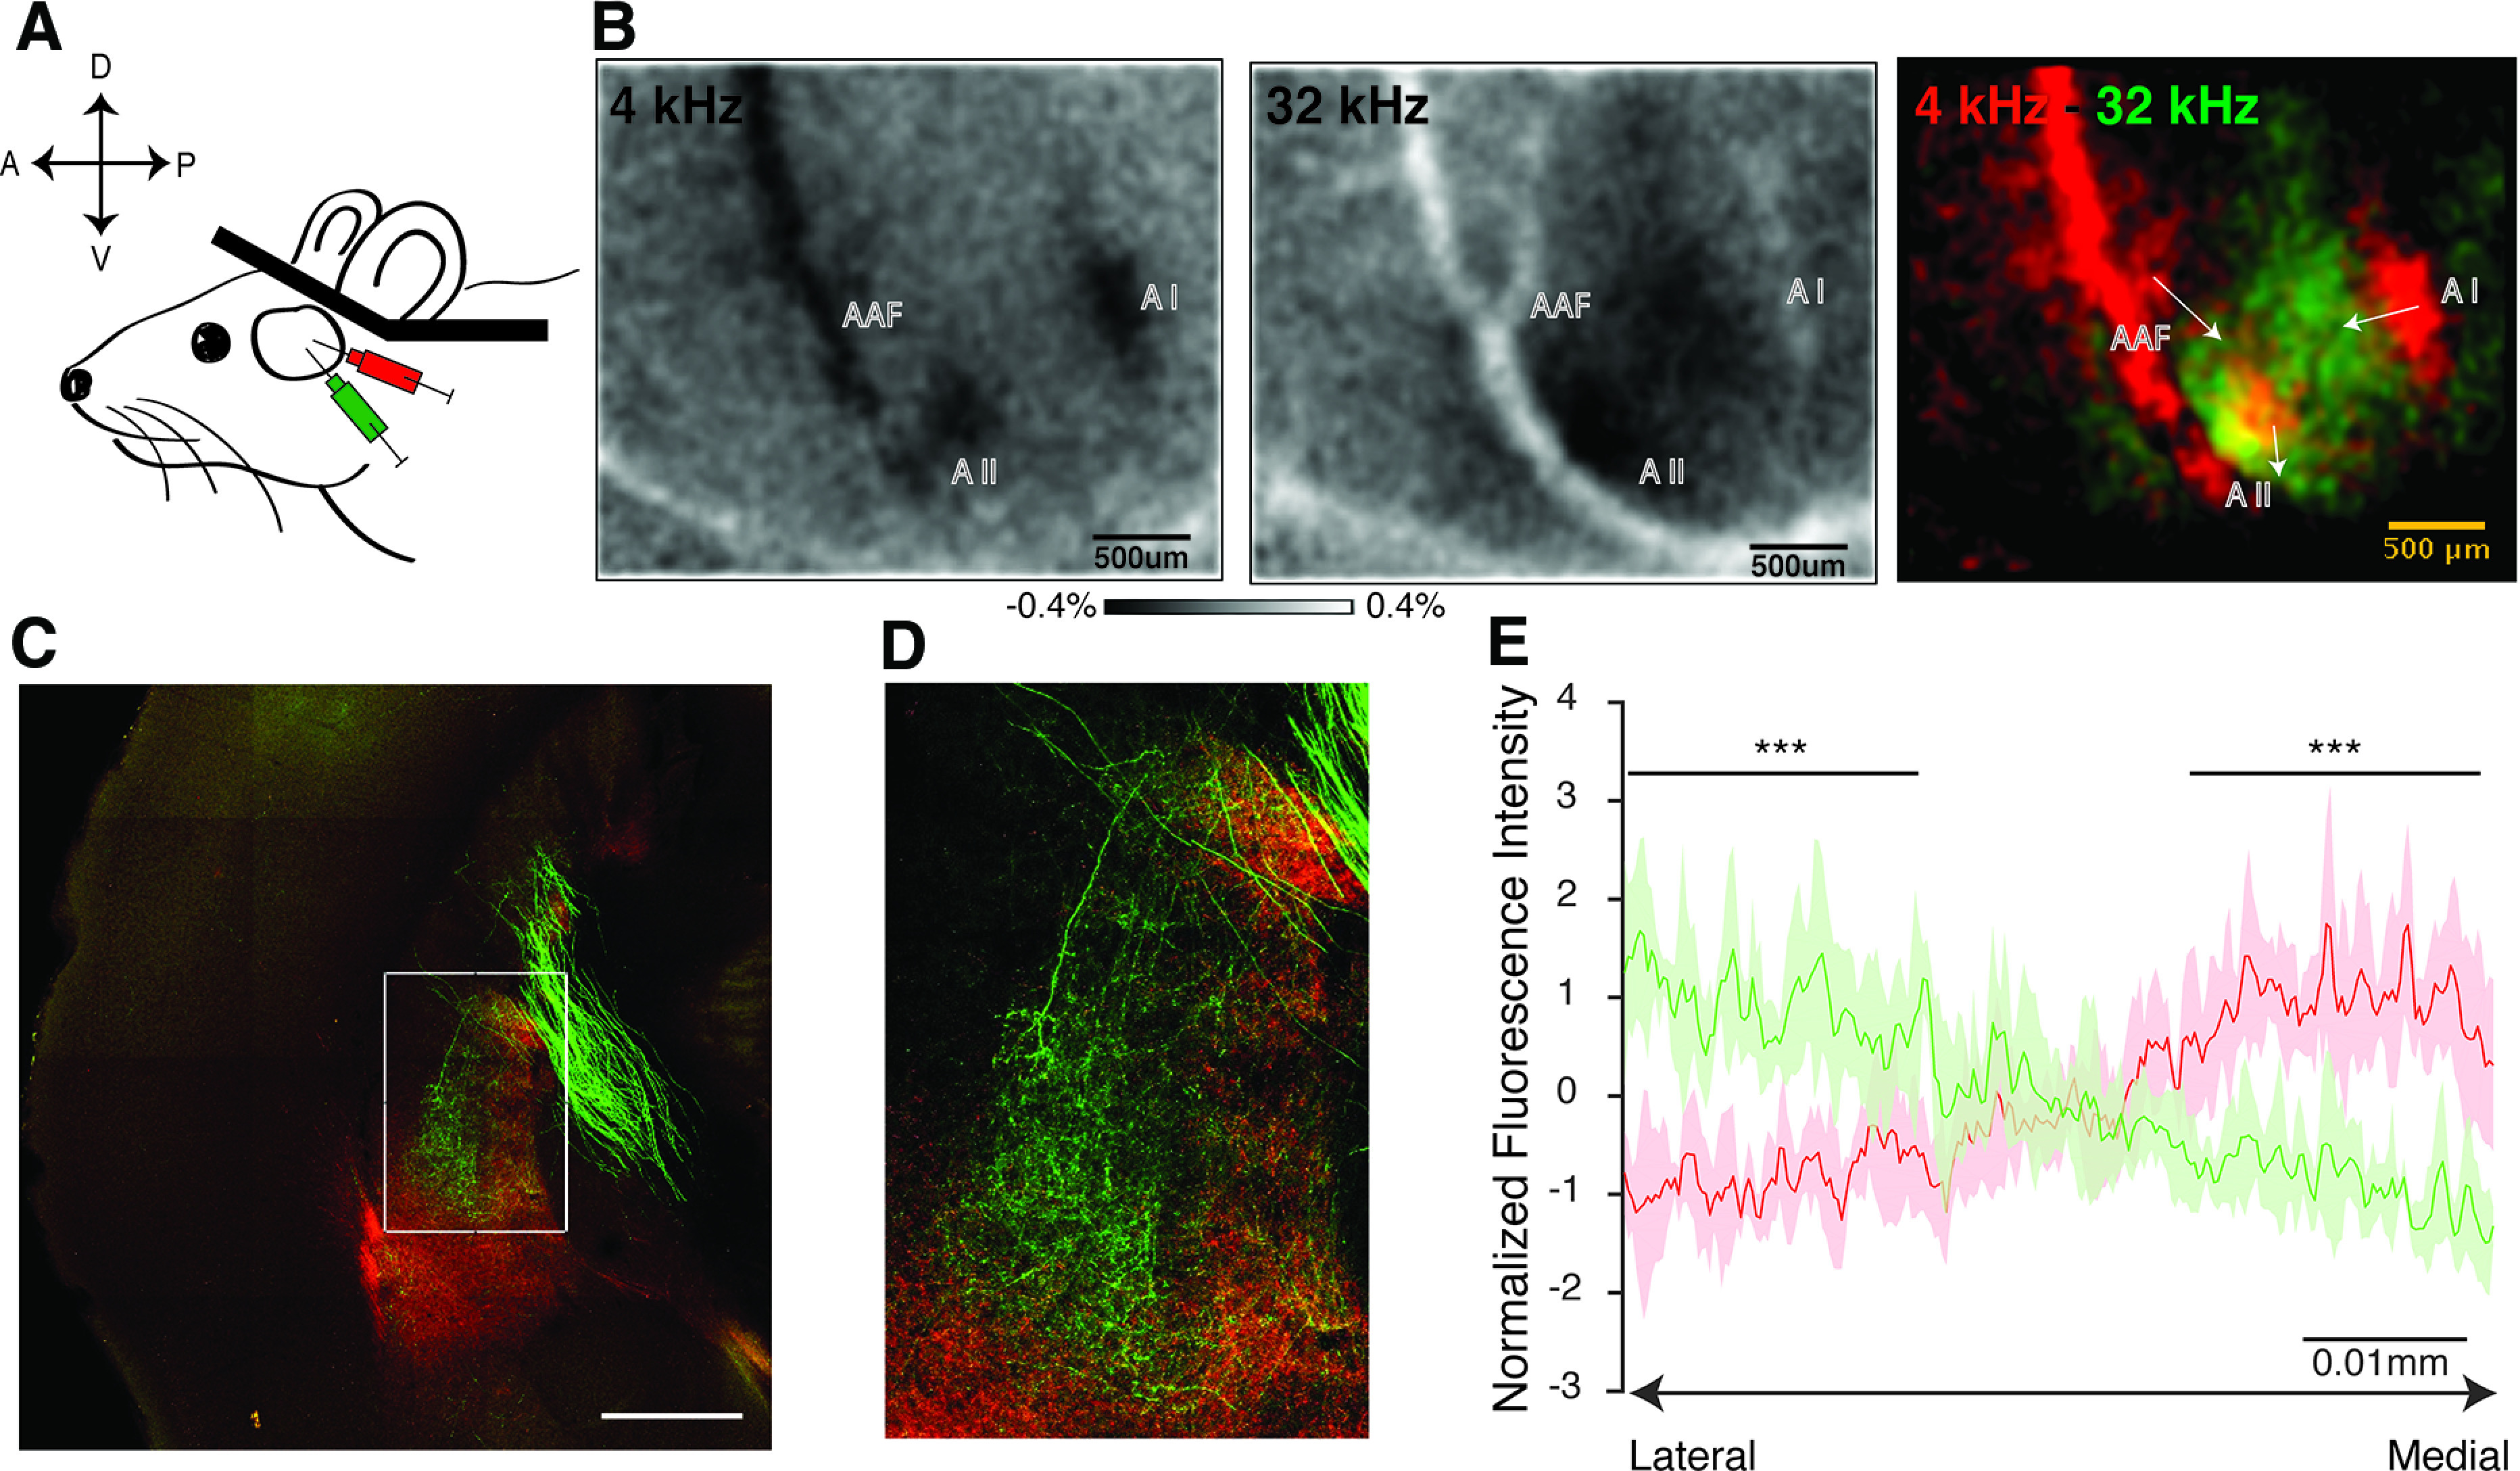
Auditory corticostriatal projections in mice are tonotopically organized. A, Intrinsic optical imaging of the auditory cortex in a head-fixed mouse through a window of thinned bone. B, Intrinsic optical images in response to pure tones of 4 and 32 kHz (left and middle) are shown for the example animal whose histology is shown later. The data shows high and low frequency loci as determined by the mean relative normalized change in reflectance between pre-stimulus period and during stimulus presentation repeated 15×. Composite image showing tonotopy in auditory cortex where green corresponds to high frequency and red to low frequency. The arrows indicate overall tonotopic gradient (low to high) in the individual tone responsive areas. C, Tonotopic separation of A1 projections into auditory striatum in a single example section showing high frequency A1 projects more laterally and low frequency A1 projects more medially (white rectangle). Scale bar = 500 μm. D, Enlarged view of auditory striatum (white rectangle) from C showing tonotopic separation. E, Z-score normalized fluorescence intensity of auditory corticostriatal projections plotted along the medio-lateral axis. The data represents mean and std. dev. of fluorescence intensity across 5 slices obtained from 2 animals after dual injections; paired t-test shows significant differences in red and green fluorescence intensity at the medial and lateral ends (p = 5.6 × 10⁻⁵, and p = 1.9 × 10⁻⁵ respectively; *** indicates p < 10-4). Additional data is available in Extended Data Figure 2-1.
