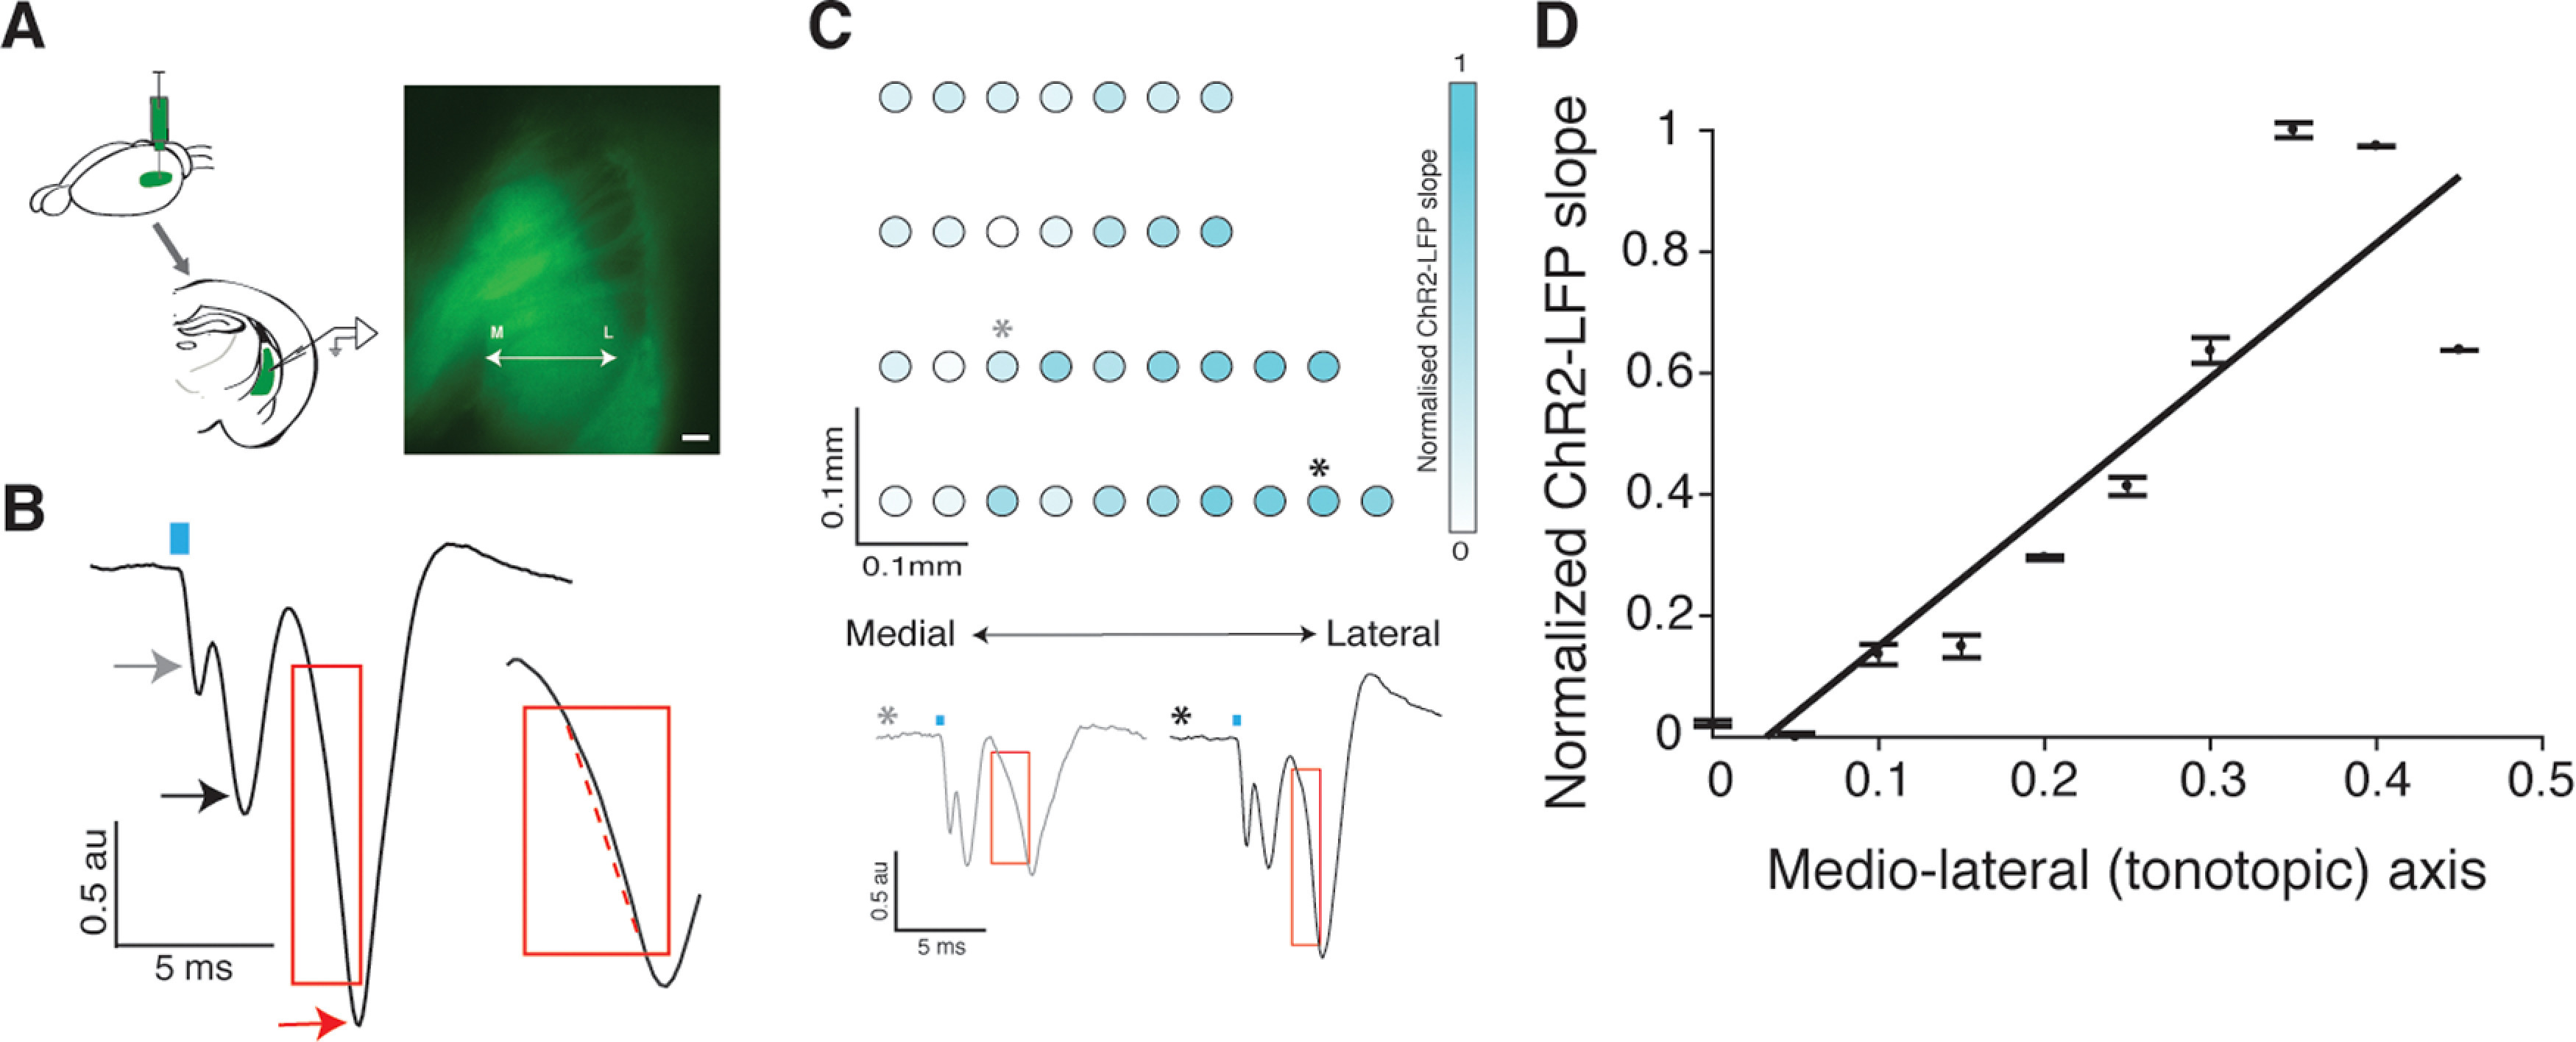
Figure 3.

ChR2-LFP slope measurements reflect the learning induced plasticity gradient. A, AAV9-ChR2 is injected in auditory cortex and recordings are obtained from acute coronal slices of auditory striatum exhibiting ChR2-expressing corticostriatal fiber terminals. Right, Example of an acute slice showing ChR2-GFP expressed in corticostriatal fibers. B, Example trace of ChR2-LFP from one position in the slice. Gray arrow indicates a light artifact often observed soon after laser stimulation (blue rectangle). Black arrow indicates the depolarization of ChR2-expressing corticostriatal fibers. Red arrow indicates the postsynaptic response of downstream striatal neurons. The response is normalized to the fiber depolarization, and the normalized ChR2-LFP slope is calculated from the postsynaptic component (red rectangle). Inset, Calculation of ChR2-LFP slope by fitting a line (dotted red line) to the postsynaptic component. C, Representative image showing distribution of individual normalized ChR2-LFP slopes along the tonotopic axis of the left auditory striatum of an example animal trained on low-left contingency. Two example traces corresponding to two data points on top are shown in the bottom of panel C. The red rectangle encloses the initial depolarization phase showing a faster depolarization for the lateral data point (black *) compared with the medial one (gray *). D, Mean and standard deviation of the ChR2-LFP slope data from C, plotted along the tonotopic axis. Slope of the linear fit to these data points is the plasticity gradient (=0.33) for this animal. Additional control data are available in Extended Data Figure 3-1.
