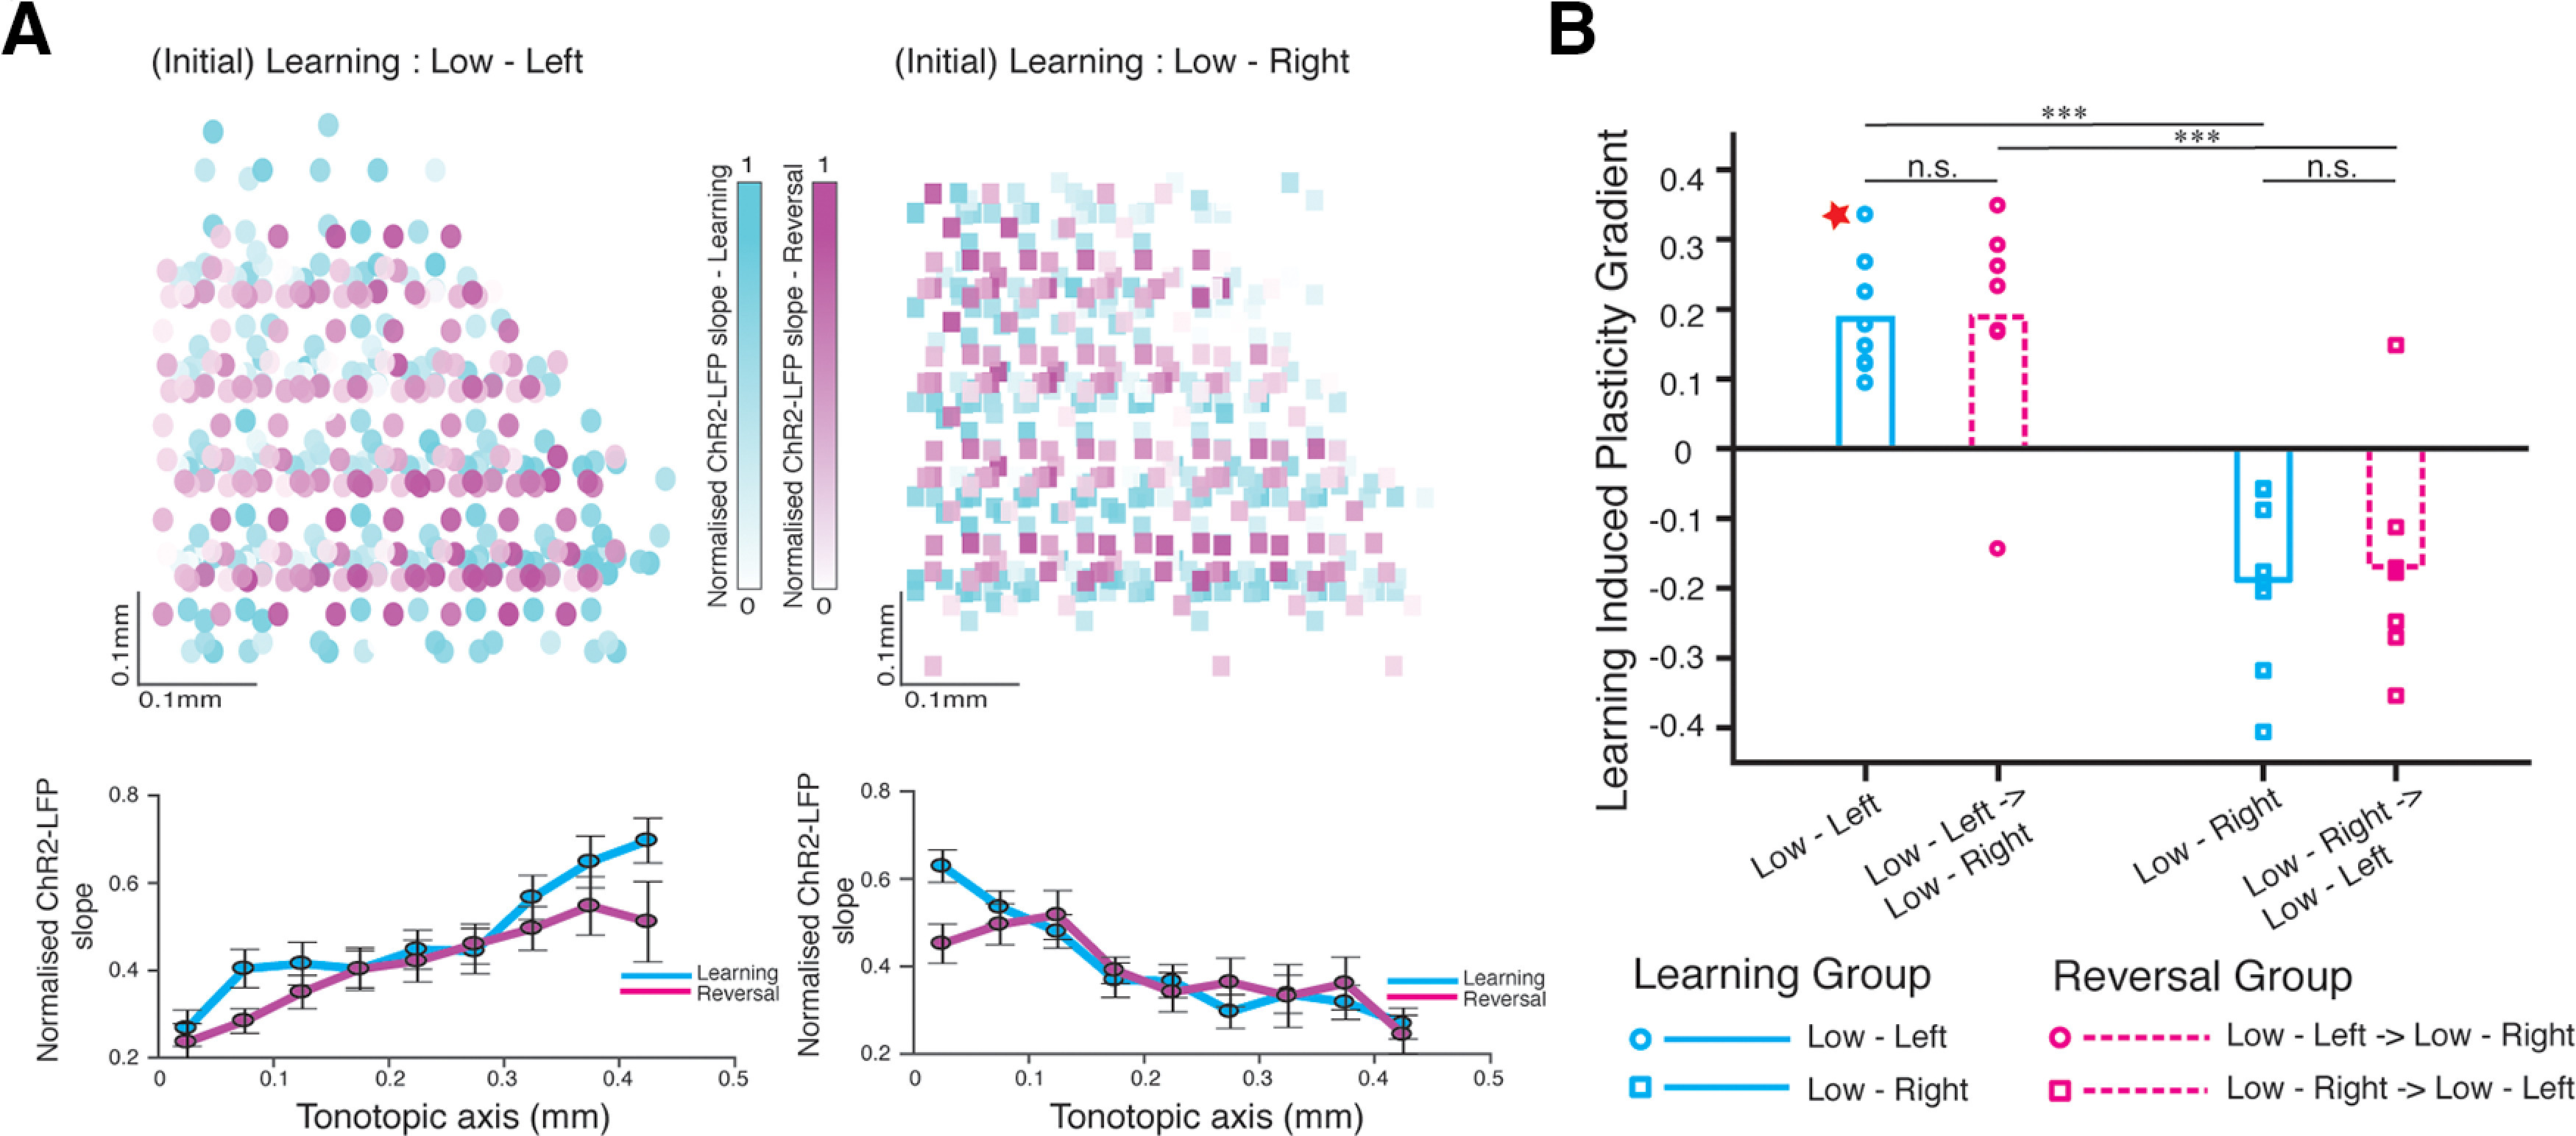
Figure 4.

Learning-induced plasticity gradient in auditory corticostriatal circuit reflects initial learning contingency. A, Top - ChR2-LFP slope after either learning alone (cyan, n = 8 animals) or reversal (magenta, n = 7 animals) from Low-Left (left) or Low-Right (right) contingency on the tonecloud task. The intensity of each point represents magnitude of normalized ChR2-LFP slope value recorded at that position of the striatal slice. Bottom - mean • SEM vs. tonotopy. Correlation coefficient of data along the tonotopic axis - Low-Left: 0.95, p < 2 × 10⁻³, Low-Left → Low-Right: 0.93, p < 1 × 10⁻³, Low-Right: −0.88, p < 1 × 10⁻³, Low-Right → Low-Left: ⊟0.77, p < 1 × 10⁻². B, Summary of learning-induced plasticity gradient from 4 groups of animals: {Learning (cyan) or Reversal (magenta)} × {Low-Left (circle) or Low-Right(square)}. Points represent individual animals. Significant differences were only observed between groups trained on opposite contingencies : Low-Left vs. Low-Right (p = 8 × 10⁻⁵) and Low-Left → Low-Right vs. Low-Right → Low-Left (p = 2 × 10⁻³), *** indicates p < 0.005; Wilcoxon Rank Sum test. The same test showed no significance between groups trained on same contingencies (n.s. = not significant; p > 0.05, Wilcoxon Rank Sum test). The plasticity gradient from the example animal shown in Figure 3D (value = 0.3) is marked here with a red star. Additional data is available in Extended Data Figure 4-1.
