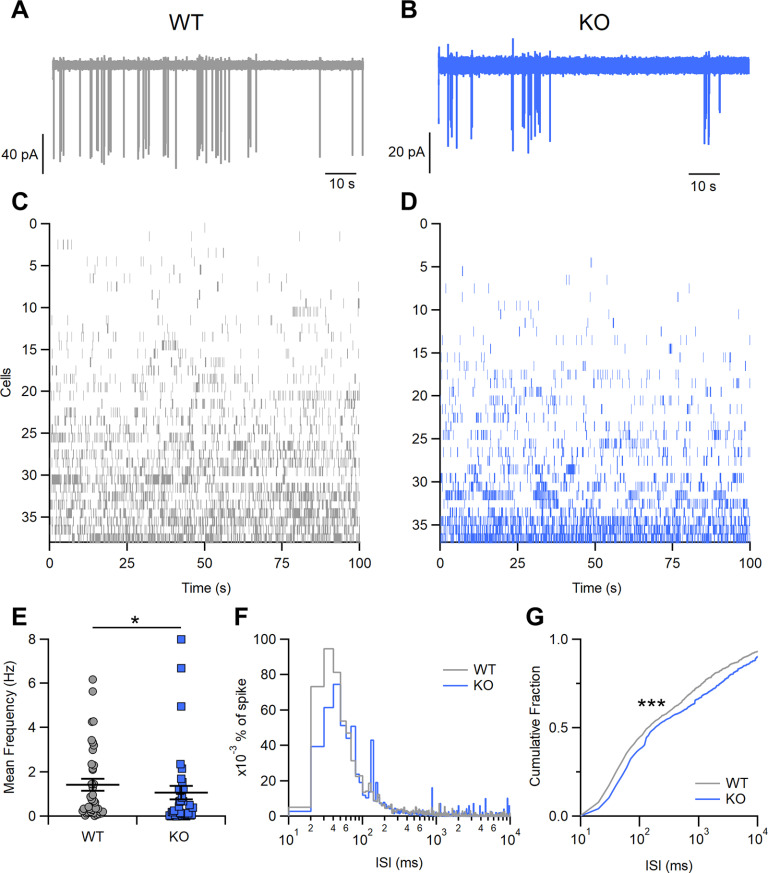
Figure 4.
Spontaneous firing activity in OSNs in WT and Stoml3 KO mice A, B, Representative loose-patch recordings showing the spontaneous activity of OSNs from acute slices of olfactory epithelium from WT and KO mice. C, D, Raster plots of recordings of spontaneous activity from several OSNs from WT and KO mice. Each row represents spike activity from a different OSN. E, Mean frequency of spontaneous activity in OSNs from WT and KO mice (n = 38 for WT and n = 37 for KO, *p < 0.05 U test). F, ISI distributions of spontaneous firing from cells shown in C, D (bin = 5 ms). Values were normalized to the area under each curve to show the spike percentages for WT or KO mice. G, Cumulative fraction of ISI distributions (***p < 0.001, Kolmogorov–Smirnov test).

