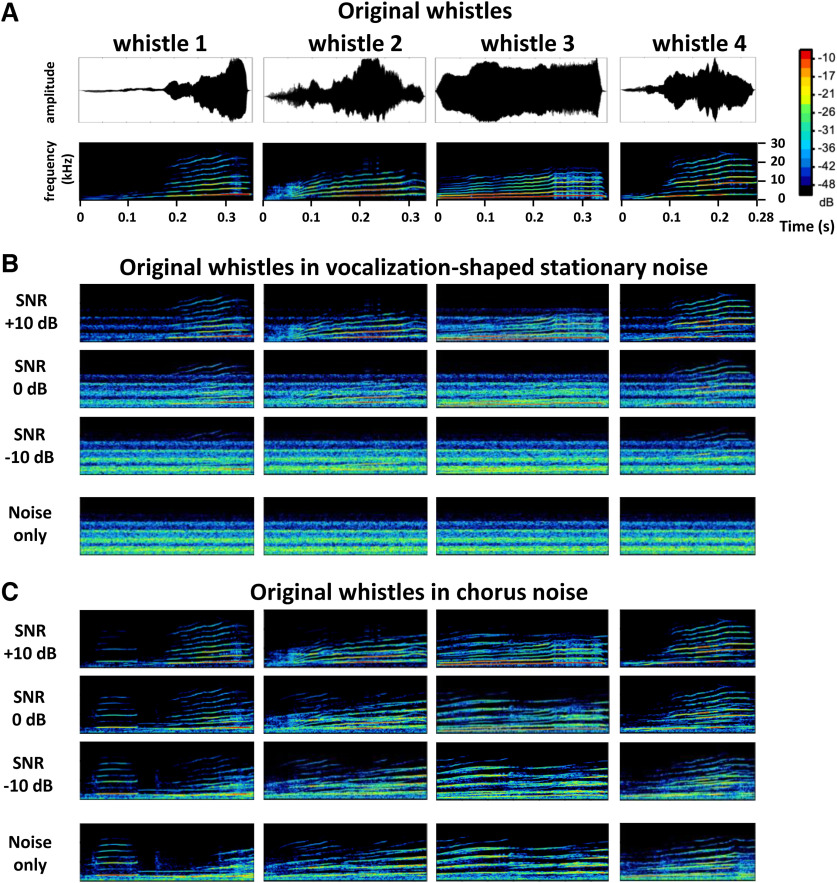
Figure 1.
Original and noisy vocalizations. A, Waveforms (top) and spectrograms (bottom) of the four original whistles used in this study. B, C, Spectrograms of the four whistles in stationary (B) and chorus (C) noise at three SNRs (+10, 0, and −10 dB, from top to bottom) and the noise only. The frequency range for all spectrograms is 0–30 kHz, and all spectrograms share the same color scale (covering a range of 50 dB).

