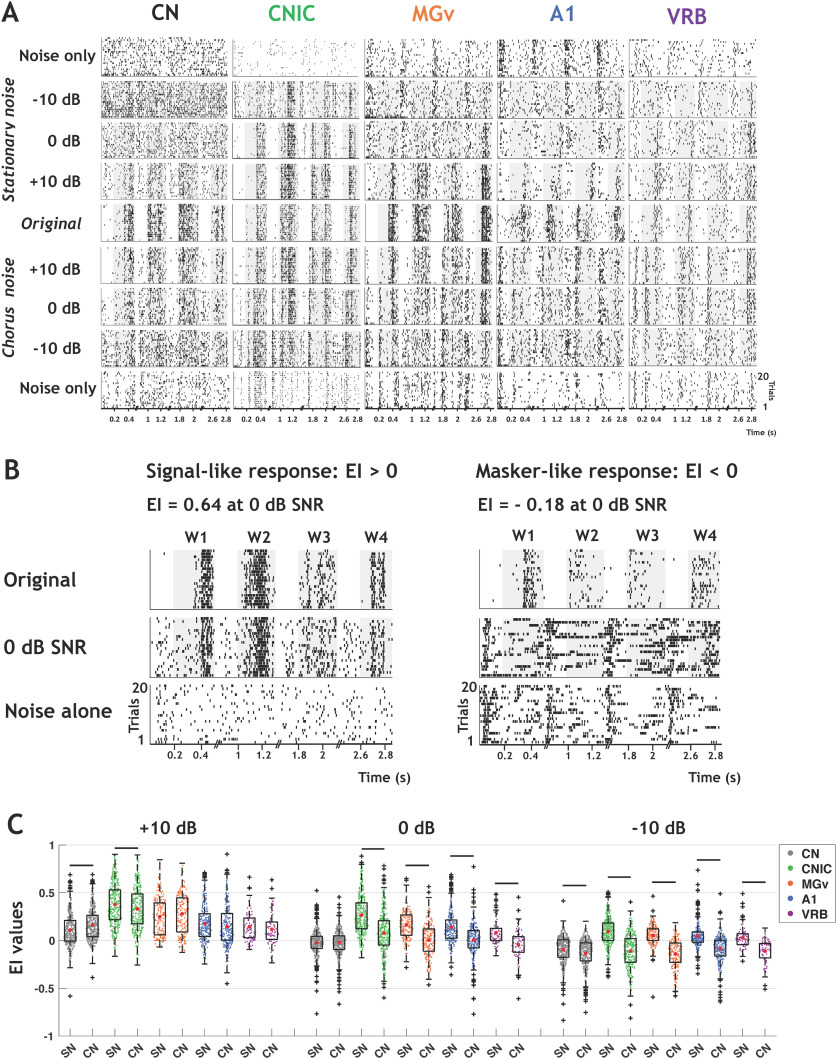
Figure 2.
The decrease in EI values is more pronounced in chorus noise than in stationary noise in each auditory structure. A, Raster plots of responses of the four original vocalizations, noisy vocalizations (in both noises), and noise alone recorded in CN, CNIC, MGv, A1, and VRB. The gray part of rasters corresponds to the evoked activity. For each structure, all the rasters correspond to the same recording. B, Rasters showing examples of neuronal responses in stationary noise with values of EI > 0 corresponding to a signal-like response (left, IC recording) and EI < 0 corresponding to a masker-like response (right, A1 recording). Top panels show the responses to the original vocalizations, the middle panels the responses to vocalizations at the 0-dB SNR in stationary noise and the bottom panels the responses to stationary noise alone. C, Box plots showing the EI values for the three SNRs obtained in CN (in black), CNIC (in green), MGv (in orange), A1 (in blue), and VRB (in purple) alternatively in stationary noise (SN) and chorus noise (CN). In each box plot, the red dot represents the mean value. The black lines represent significant differences between the mean values (one-way ANOVAs, p < 0.001; with post hoc paired t tests, pa+10 dB,CN = 4.03e-18, pb+10 dB, CNIC = 1.45e-07, pc0dB, CNIC = 2.47e-45, pd0dB, MGv = 2.11e-30, pe0dB, A1 = 5.41e-25, pf0dB,VRB = 6.36e-10, pg-10 dB, CN = 5.74e-12, ph-10 dB, CNIC = 1.83e-59, pi-10 dB, MGv = 1.16e-36, pj-10 dB, A1 = 2.84e-24, pk+10 dB, VRB = 4.62e-11).

