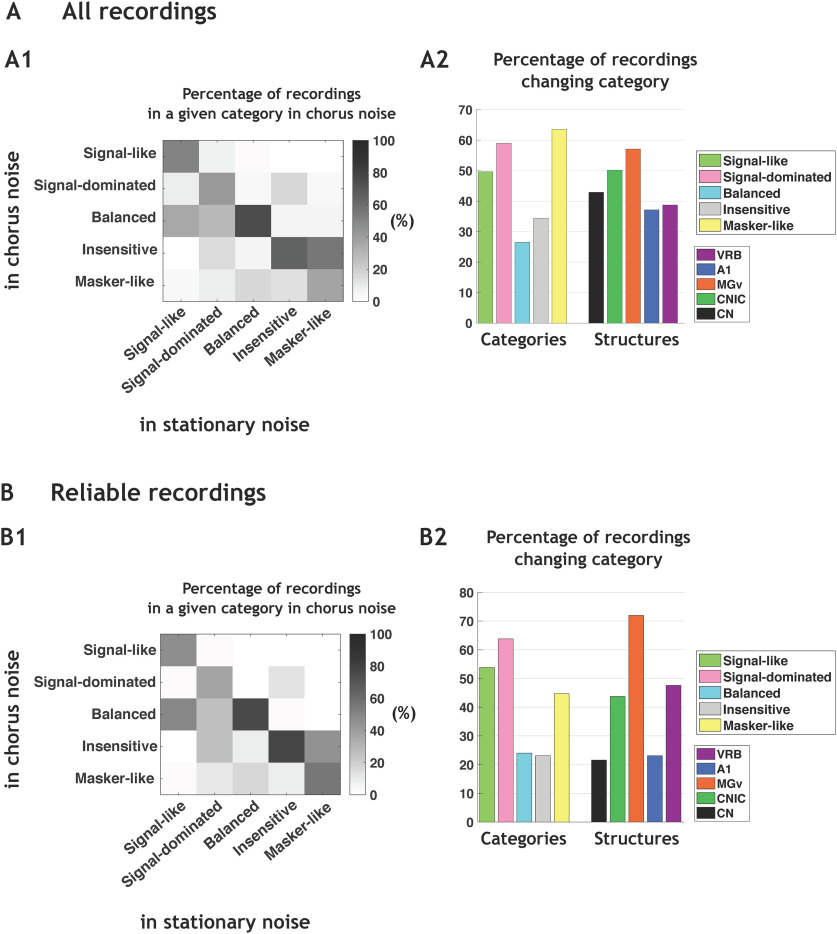
Figure 5.
The noise-type sensitivity is found at each stage of the auditory system. A1, Group-switching matrix representing the percentage of recordings in a given category in chorus noise depending on the category originally assigned in the stationary noise. The abscissas indicate the category identity in the stationary noise, and the ordinates represent the category identity in the chorus noise. For example, signal-like responses in stationary noise are also 50% signal-like in chorus noise but 10% are reclassified as signal-dominated, 35% balanced, 1.5% insensitive, and 3.5% masker-like. Note that, in stationary noise, the number of recordings in each category were 139, 346, 83, 540, and 159 in signal-like, signal-dominated, balanced, insensitive, and masker-like category, respectively. A2, Mean percentages of recordings changing category from the stationary noise to the chorus noise, first in each category and second in each structure [VRB, (in purple), A1 (in blue), MGv (in orange), CNIC (in green), and CN (in black)]. B1, Group-switching matrix representing the percentages of recordings changing category from the stationary noise to the chorus noise based only on recordings considered as reliable with the bootstrap procedure in the two types of noise (with a confidence interval ⩾95%). B2, Mean percentages of recordings changing category from the stationary noise to the chorus noise, first in each category and second in each structure [VRB, (in purple), A1 (in blue), MGv (in orange), CNIC (in green), and CN (in black)].

