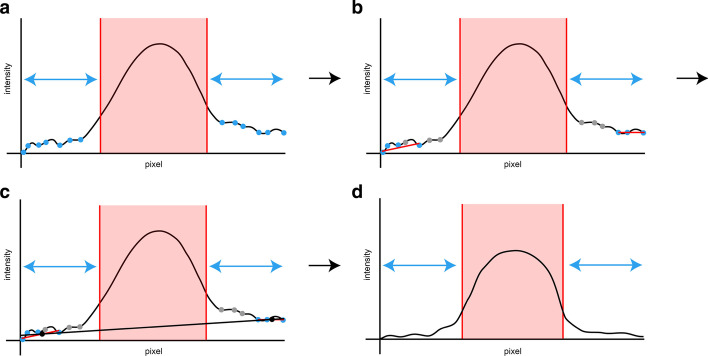
Fig. 2.
Calculation of background correction. (a) Finding local minima in intervals between the start (end) of the intensity profile and left (right) side of the selected area. (b) Calculation of the linear model on left and right side through points that have lower intensities than is the median of all points for that interval (at least 3 points needed). (c) Calculation of the linear model through the points that are in the middle of the linear models (if number of points < 3, minima of intervals are used instead). (d) Recalculation of the intensity profile by taking out the area under the linear model calculated in the previous panel C from the intensity profile (negative values are taken as zero). (Figure created using Adobe Illustrator CS6)

