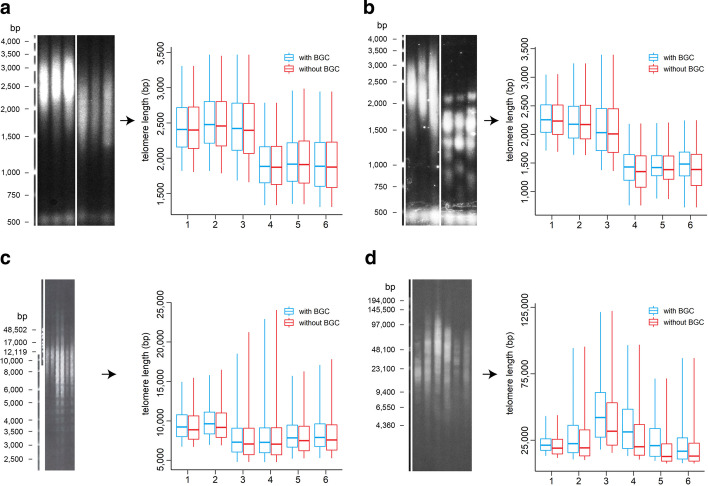
Fig. 3.
Influence of background correction on the WALTER result. Telomeres of Arabidopsis thaliana control and mutant plants (a), Arabidopsis thaliana control plants and tert mutants (SALK_061434; loss of function of the gene encoding the telomerase protein subunit) with typical band-like pattern (b), human cells (c), and Nicotiana species (d) were analysed. In the boxplot, the central line indicates the weighted median, box limits indicate the 25th and 75th percentiles and whiskers indicate the minimum and maximum of the selected area of telomeres. BGC—background correction. (Figure created using Adobe Photoshop CS6 and R 3.5.3)

