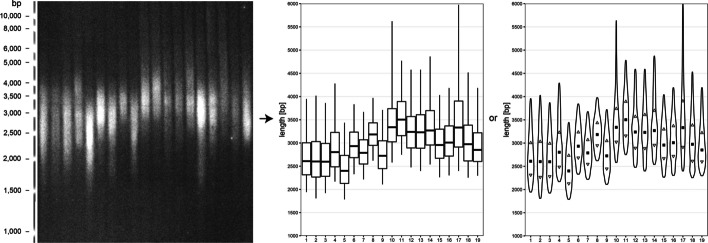
Fig. 4.
Inter-individual variability in telomere lengths in Arabidopsis thaliana plants. TRF scan of 19 samples of Arabidopsis thaliana ecotype Columbia and plots from WALTER analysis. In the boxplot, the central line indicates the weighted median, box limits indicate the 25th and 75th percentiles and whiskers indicate the minimum and maximum of the selected area of telomeres. In the violin plot, the rectangle indicates the weighted median, triangles indicate the 25th and 75th percentiles and the shape of the violin plot depicts the intensity changes between the minimum and maximum of the selected area of telomeres. Variance of the weighted medians of telomere lengths is approximately 1100 bp. (Figure created using Adobe Photoshop CS6)

