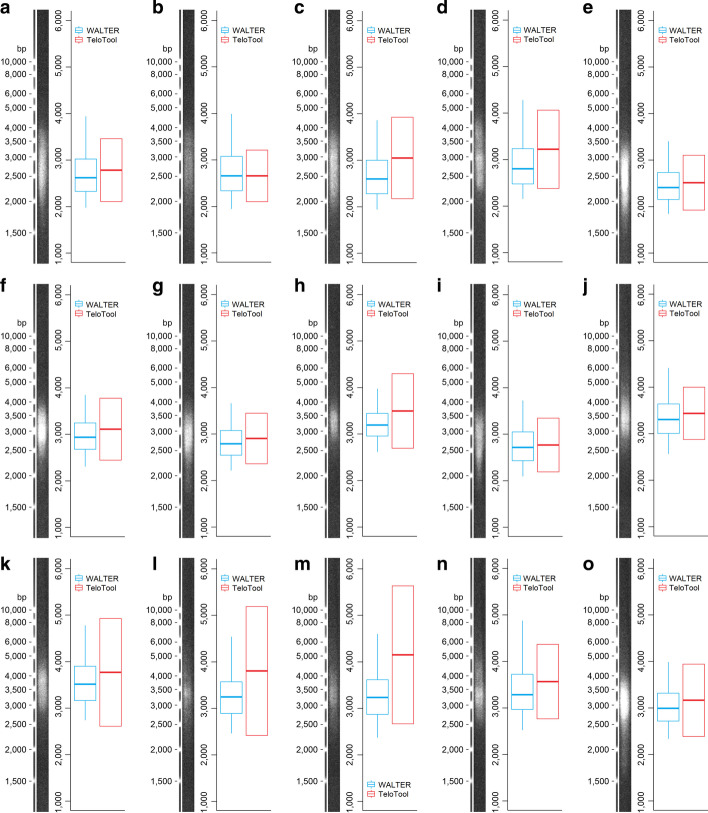
Fig. 7.
Comparison between WALTER and TeloTool. (a-o) Telomeric signals analysed by WALTER and TeloTool, respectively. In the case of the WALTER result, the central line indicates the weighted median, box limits indicate the 25th and 75th percentiles and whiskers indicate the minimum and maximum of the selected area of telomeres. In the case of TeloTool, the central line indicates the mean, and the box delimits the SD values; the corrected data option in TeloTool was used to obtain the values. (Figure created using Adobe Photoshop CS6 and R 3.5.3)

