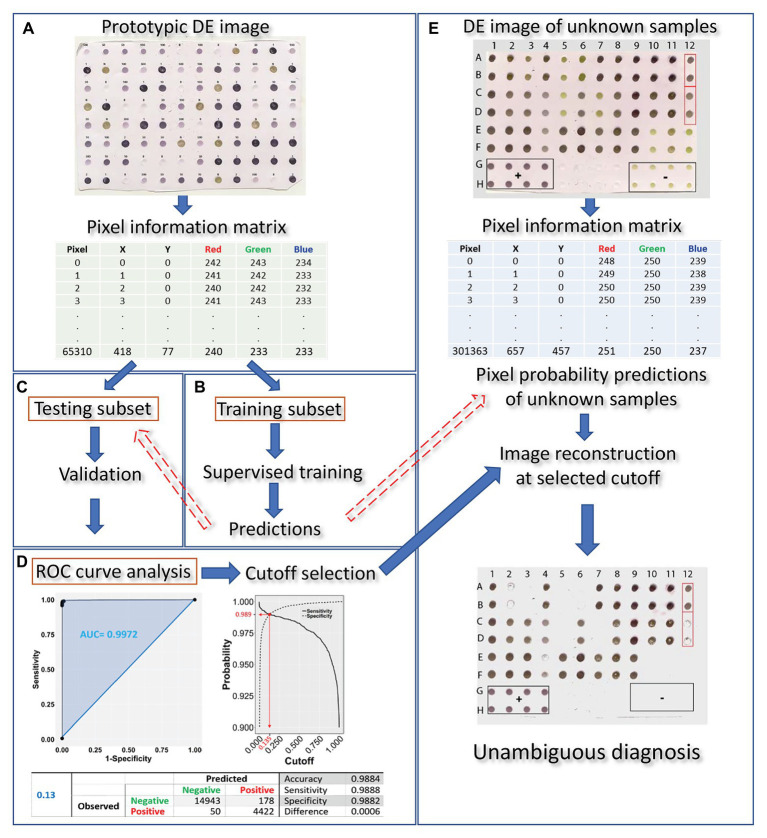
Figure 1.
Overview of the proposed machine learning approach for DE output evaluation that harnesses pixel information for dot classification and diagnosis in merely a few hundreds of seconds after running the blot using standard methods. The DE output is first scanned (at a resolution of 150 dpi) and the prototypic image is converted to a matrix, holding pixel position and color information for all pixels contained in the dots (A). The matrix is then randomly tessellated into a training and testing dataset at a 70:30 ratio. Next, training of the classifier algorithm (B) is supervised by a logistic model of choice which, following validation (C), is used for infection status predictions on the testing subset. Receiver operating characteristic (ROC) curve analysis allows for selection of an appropriate cutoff (D). The procedure of scanning the blot and harnessing its pixel information is repeated on a DE of unknown samples (E). Pixel probabilities of the unknown samples are predicted by the trained classifier and a new image of the blot, with dots consisting of pixels with probabilities above the selected cutoff, is reconstituted, allowing for proper dot classification and, hence, unambiguous diagnosis.

