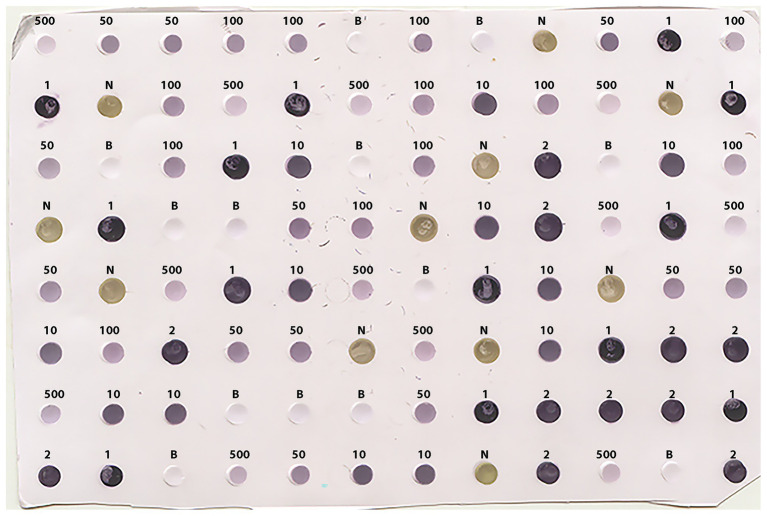
Figure 2.
Scanned image (at 150 dpi resolution) of the prototypic DE output used for training the classifier algorithm. Positive, negative, and buffer controls were randomly distributed on the membrane in 12, 11, and 13 replicates, respectively. The letters on top of the dots denote the Buffer (B) and the negative (N) controls, while the numbers 1, 2, 10, 50, 100, and 500 denote no dilution, or 1:2, 1:10, 1:50, 1:100, and 1:500 dilutions of the positive control (LBVaV virus standard, Prime Diagnostics, The Netherlands), respectively.

