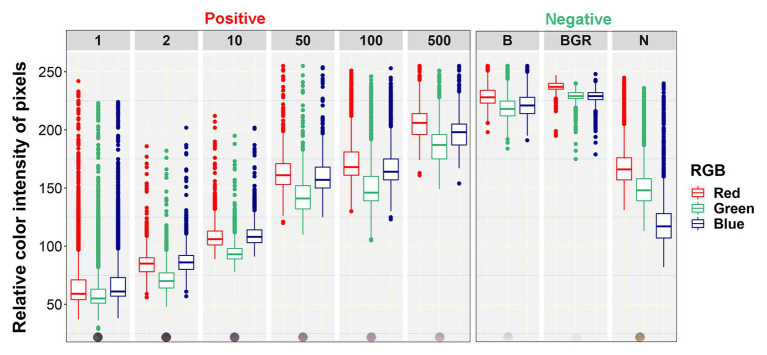
Figure 3.
Box plots of relative color intensity of prototypic blot pixels of different categories. Numbers above the plots indicate the undiluted status (1) or dilutions of the positive control (1:2, 1:10, 1:50, 1:100, and 1:500), while letters indicate the Buffer alone (B), background area around the dots (BGR), and Negative (N) controls.

