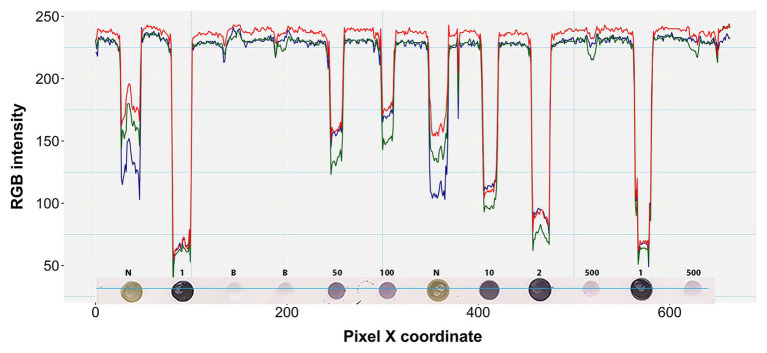
Figure 4.
RGB pixel intensity vs. dot coloration patterns in a perceived one pixel-wide line. A four pixel-wide line (~6 pixels per mm) is actually shown here traversing the fourth row of the prototypic blot image at a representative point of the Y-axis (Y = 204). Each dot on the blot is a raster or bitmap image of ~200 pixels. Numbers above the dots denote the undiluted status (1) or dilution factor of positive samples. N and B denote negative and buffer controls, respectively.

